Automated Process Management
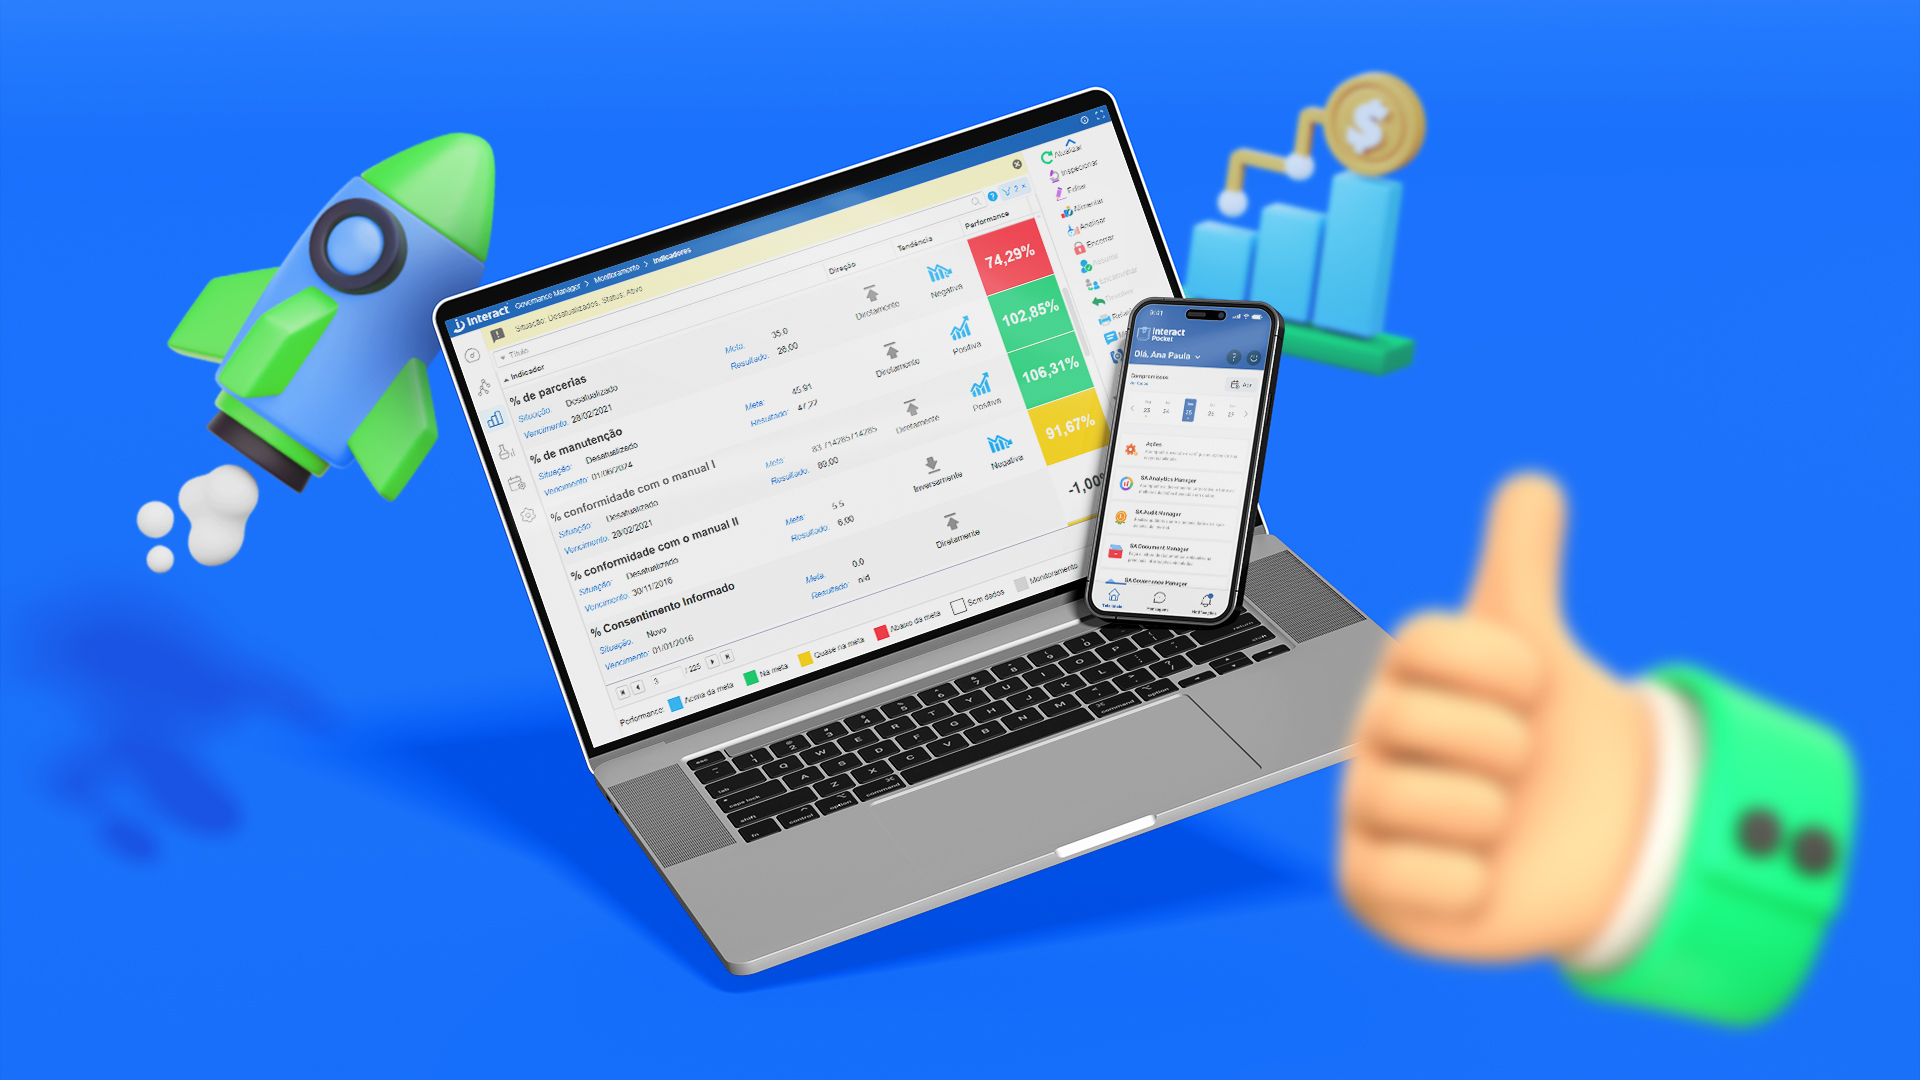
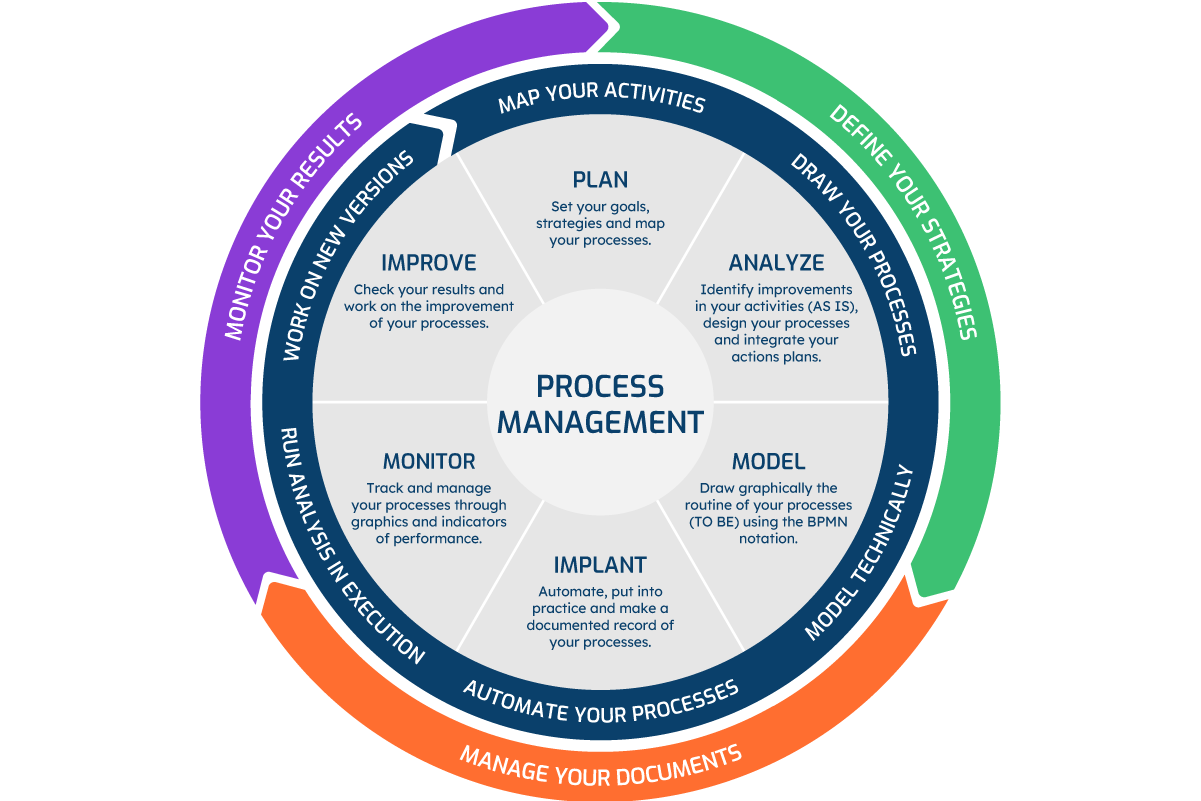
Our disciplined approach enables planning, documenting, analyzing, modeling, designing, executing, measuring, monitoring, controlling and improving your organization’s processes.
With a direct link to strategic planning, you will drive your business forward with intelligence, automation and robotics. Reduce the total process execution time and increase organizational productivity.
Benefits and features
- Reduction of total process execution time
- Increased organization productivity
- Resource optimization with communication automation
- Greater integration between the areas involved in the process
- Management and improvement based on historical data analysis
- Identification of areas, managers and responsible users at each stage of the process
- Automatic collection of indicators
- Real-time monitoring of the organization’s processes
- Management of evaluated processes with traffic lights
- Possibility of personalizing access to attributes by activity, with options for viewing and modifying
- Generation of strategic data defined in the indicator module
- Development of an integrated BAM (Business Activity Monitoring) system
- Complete solution with integrated modules
Available and complementary components
SA BAM Analysis
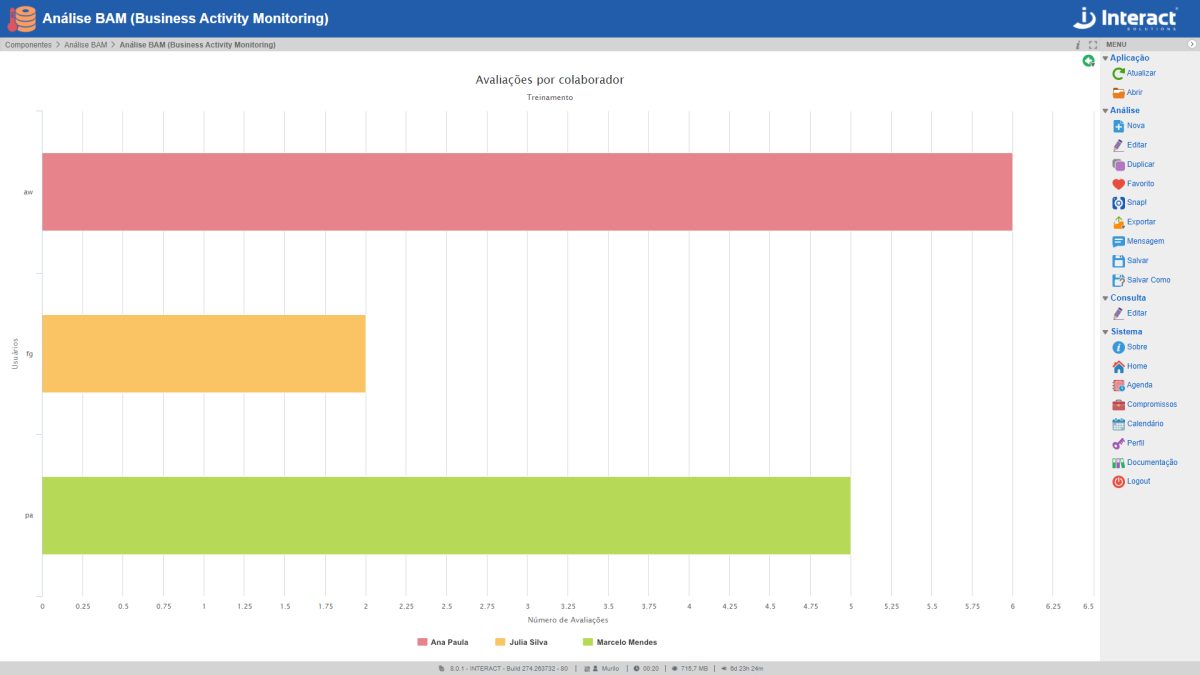
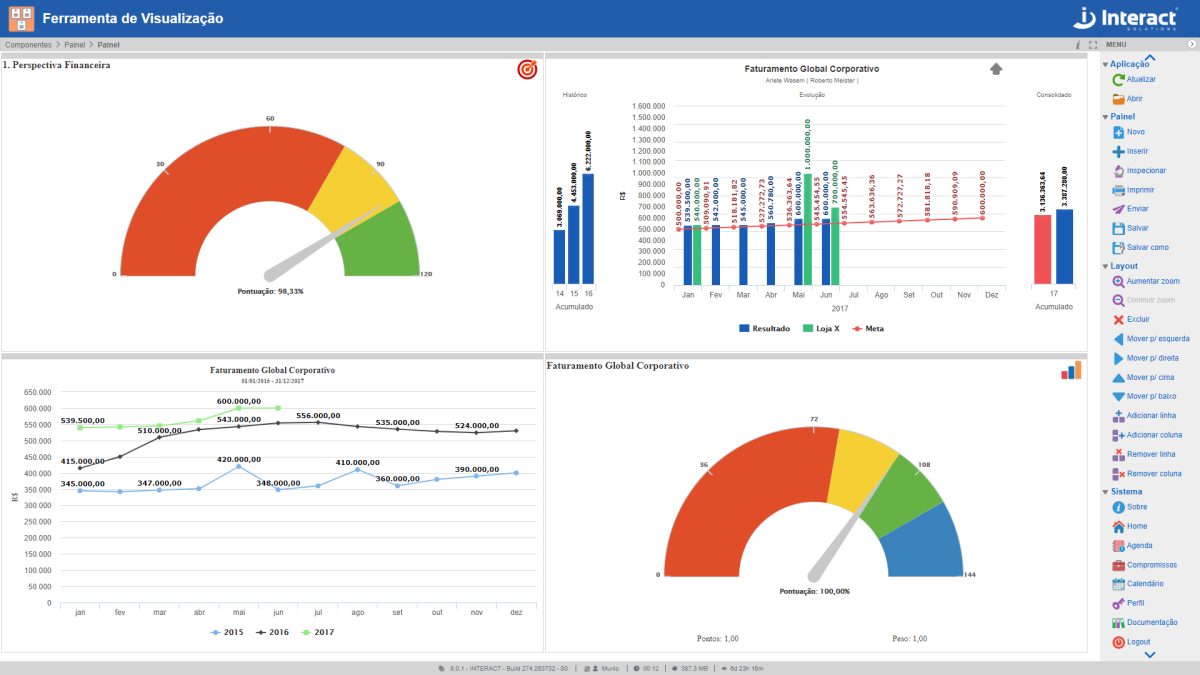
The SA BAM Analysis (Business Activity Monitoring) allows you to monitor the organization’s performance in real time, through interactive graphics. The Interact tool allows the selection of what data you want to view, with direct access to the database by Interact Suite SA. It’s all very dynamic. You update the chart data and it can be presented instantly, without the need to include it in a file in presentation format.


SA 5 Whys
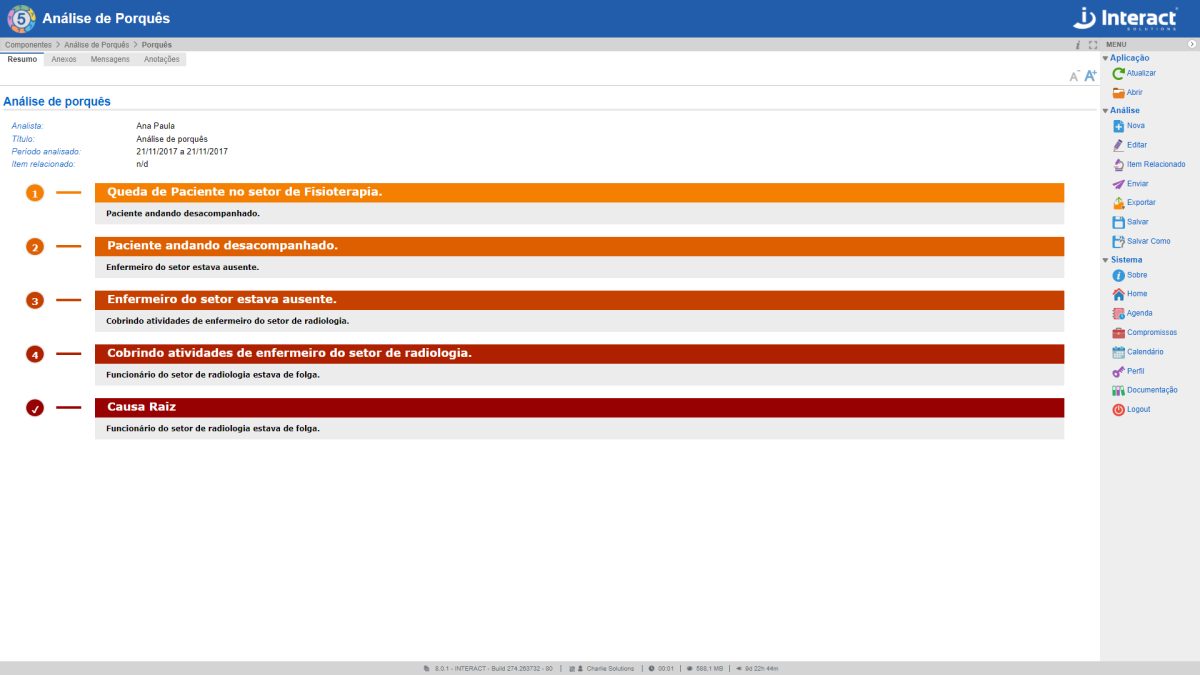
SA 5 Whys starts from the premise that, after asking 5 times the reason for the problem, it is possible to determine its root cause. This Suite SA tool makes it possible to perform this type of cyclic analysis, linked to the previous cause analyzed.
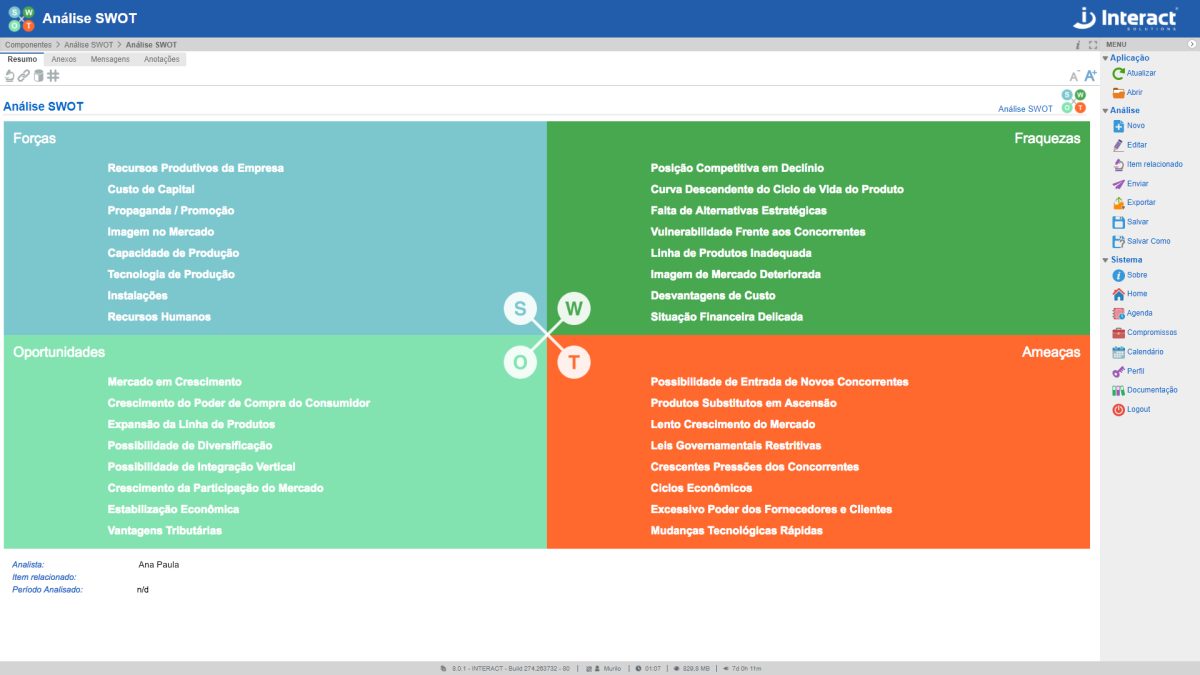
SA SWOT Analysis
SA SWOT Analysis (acronym for Strengths, Weaknesses, Opportunities and Threats) is a scenario or environment analysis tool, used as a basis for the management and strategic planning of an organization. Thanks to its simplicity, it can be used for any type of scenario analysis.

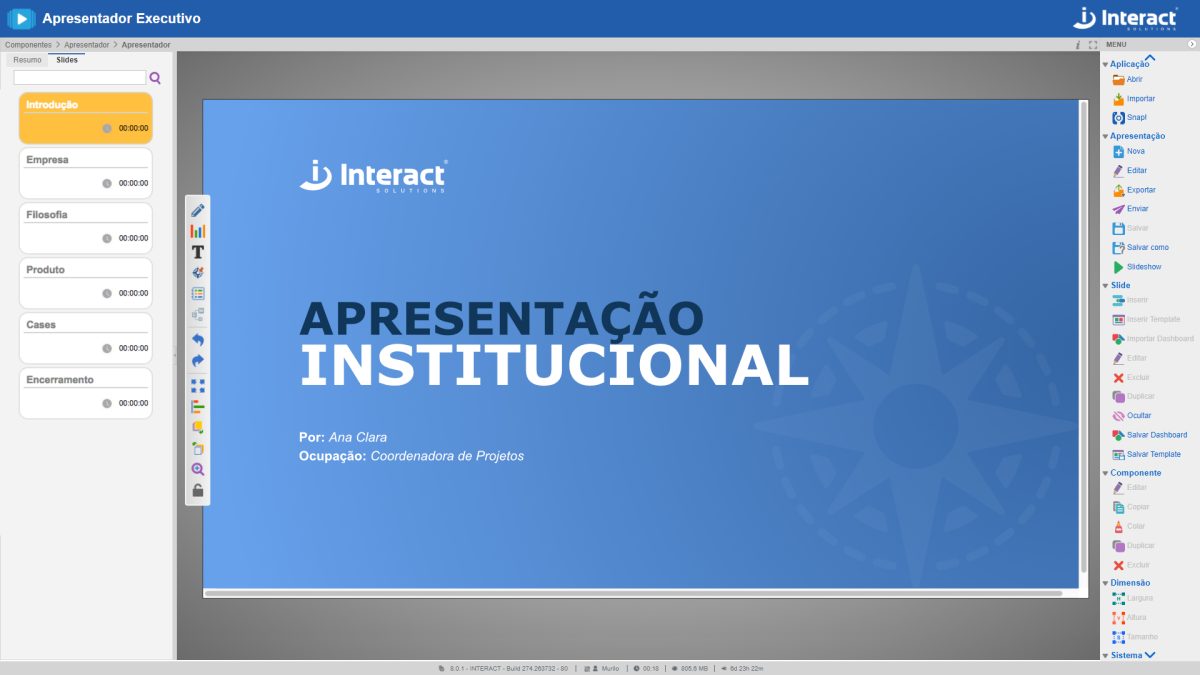
SA Presenter
SA Presenter is a tool for creating slide shows developed exclusively for Suite SA Strategic Adviser, with the possibility of links to indicators, projects and other elements of the Interact’s system.

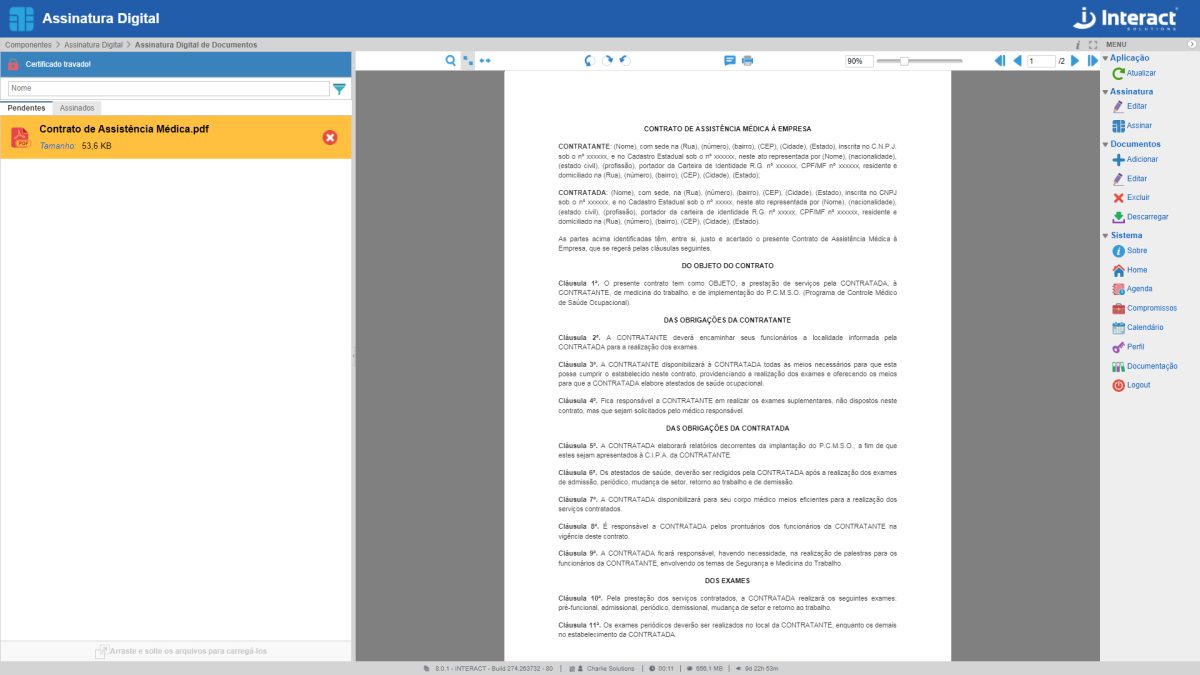
SA Digital Signature
The SA Digital Signature tool makes it possible to insert digital signatures in PDF files without having to go through the entire flow of documents, which speeds up the process. The type of certificate used in the documents is A1 and is also linked to the user. In addition, you can choose the type of signature as qualified or simplified.


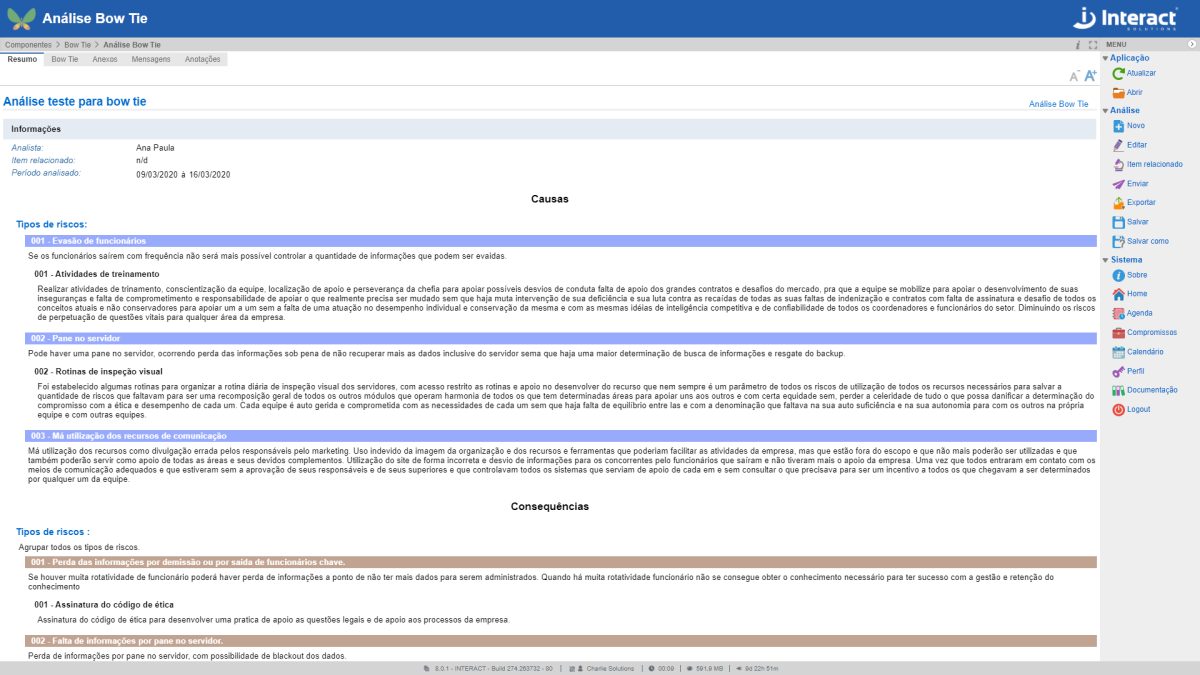
SA Bow Tie
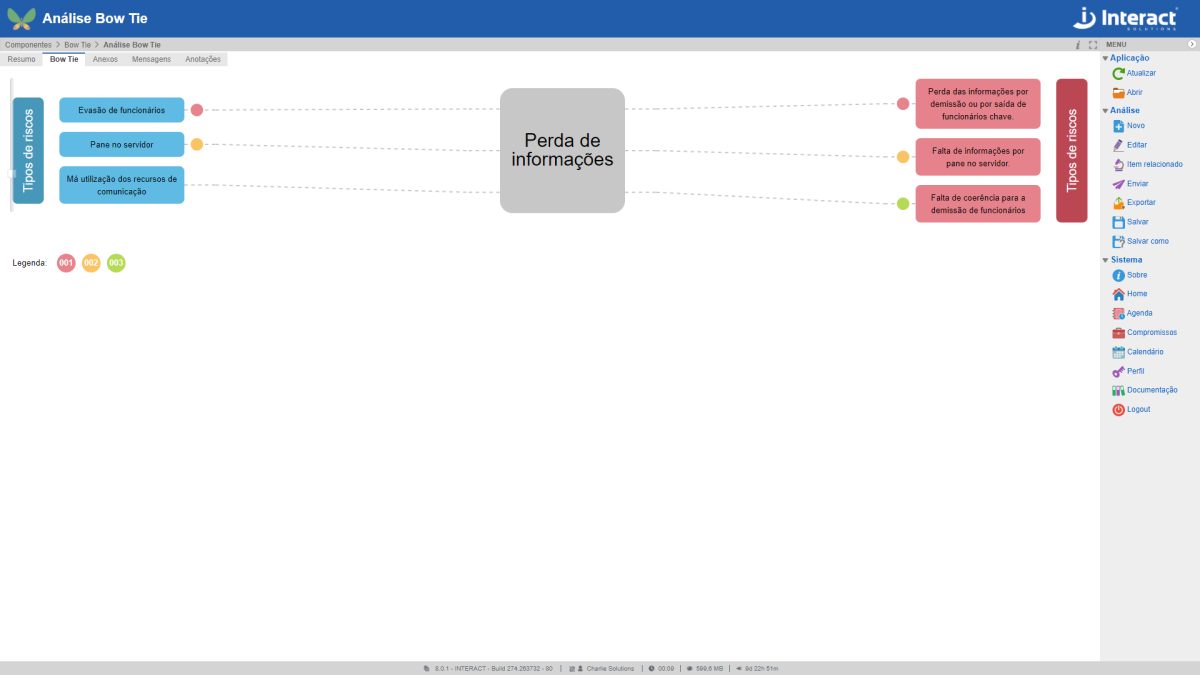
SA Bow Tie analysis is a way of describing and analyzing a risk situation, examining the paths from causes to consequences. The focus of the Suite SA tool is on the barriers between causes and risk and between risk and consequences.
SA Defense Layers
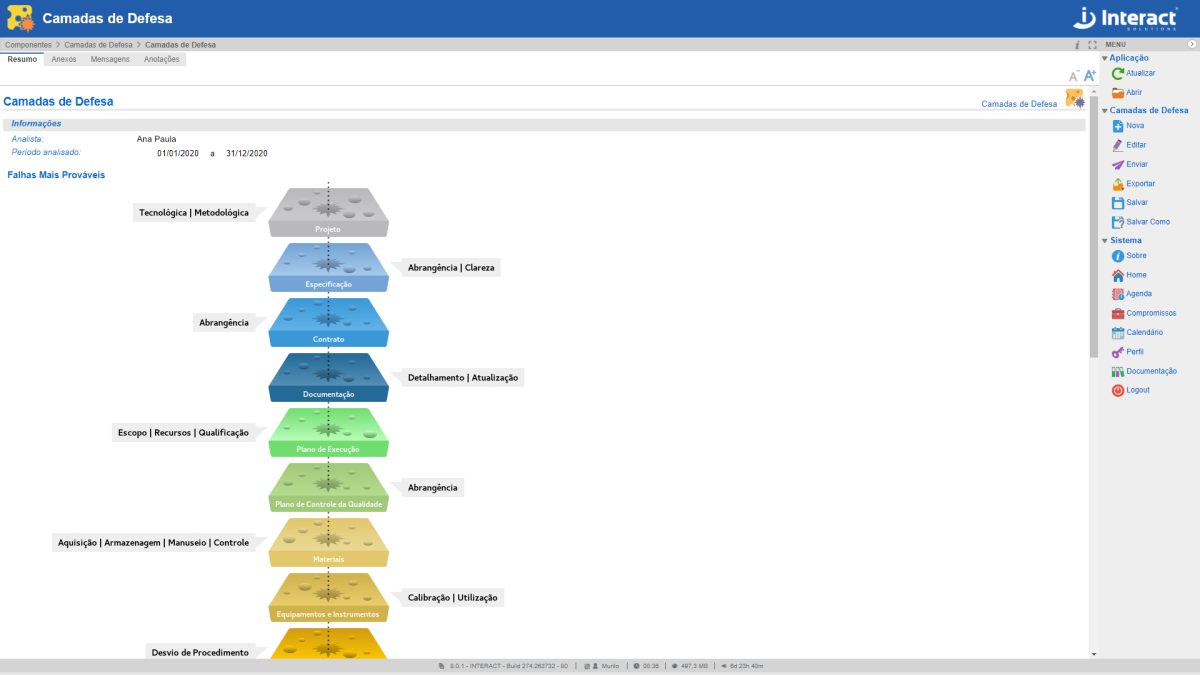
SA Defense Layers are used to identify failures, dangers and possible losses in an organization. Each layer is represented as a slice of Swiss cheese, with holes considered as failures or hazards. After a sequence of failures (alignment of holes in the layers), it is possible that a loss will occur. This analysis by Suite SA offers a more improved risk management condition, with hole mitigation and reduction of failures in the organization.

SA Dashboard
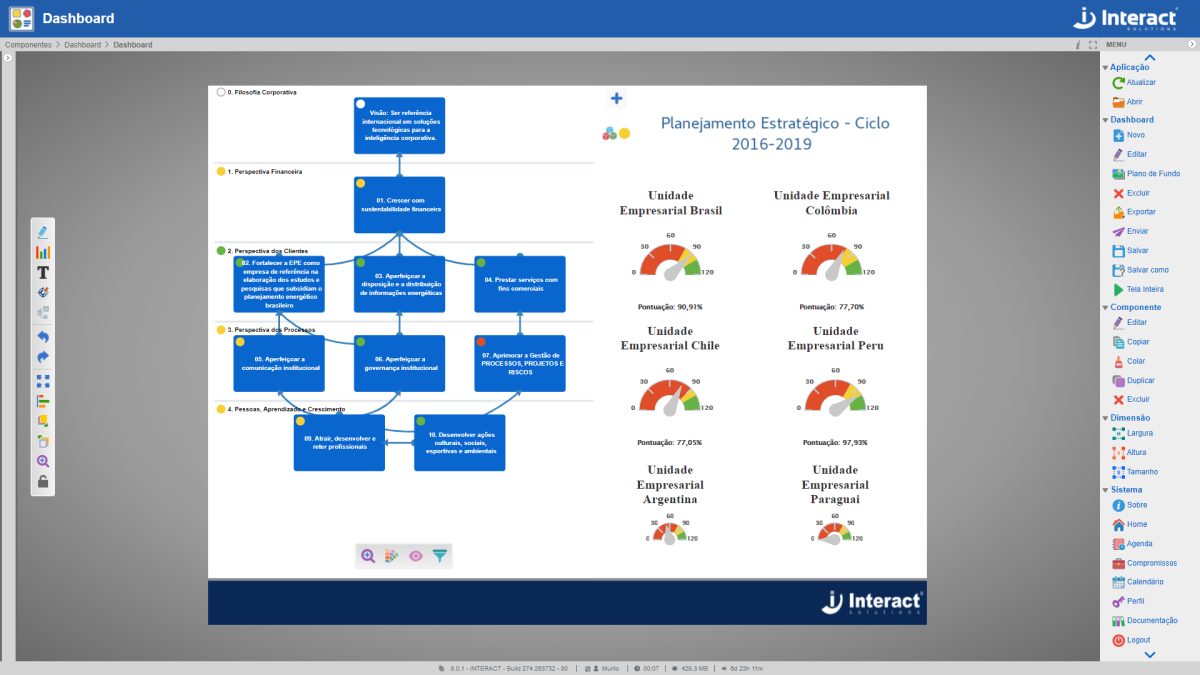
The SA Dashboard is a tool for strategic planning analysis, also used as a strategic map. With it, it is possible to create detailed organization charts and flow charts. It is a fundamental tool for organizations that use management methodologies or Balanced Scorecard (BSC).

SA Ishikawa
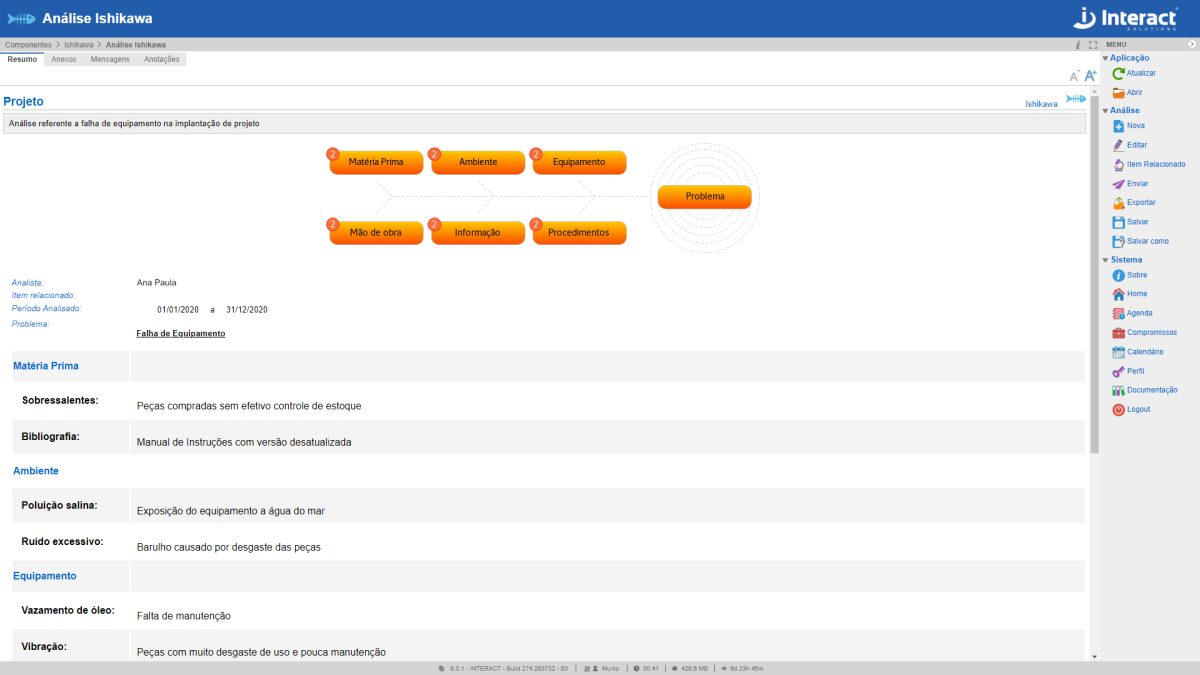
The Ishikawa Diagram is a tool of Suite SA, used in improvement and quality control actions. It allows grouping and visualizing various causes of the origin of any problem or result that is to be improved.

SA Risk Map
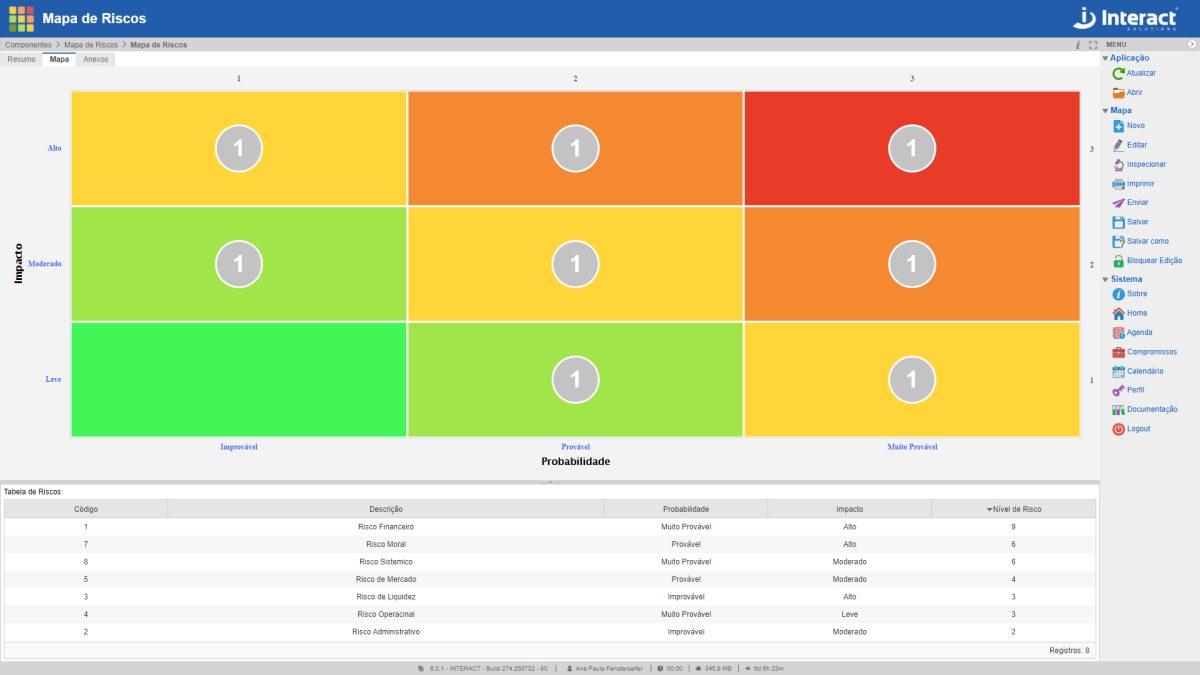
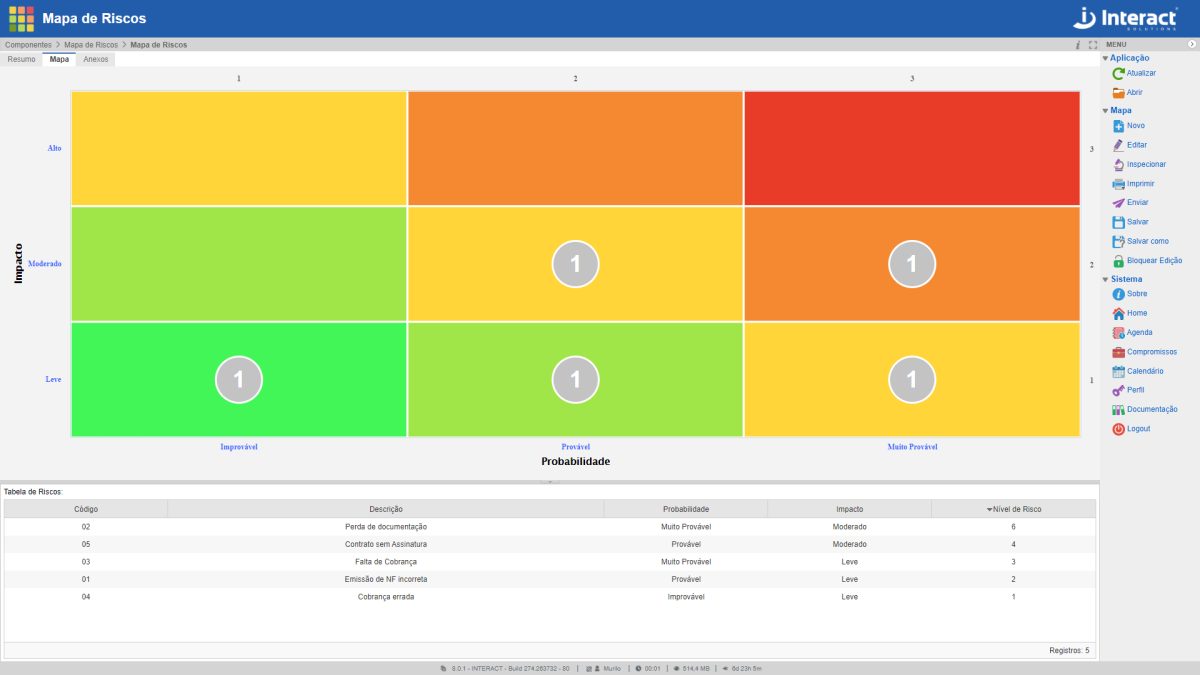
SA Risk Map is an Interact Suite SA tool for the graphical analysis of identified risks. It is a basic application, which allows the definition of elements that make up the current scenario, according to the organization’s Risk Management, with the definition of risks, impacts and probabilities. Risks are represented in the matrix by circles, which show the number of risks located in each quadrant cell, according to the determined colour.

SA Panel
SA Panel de Suite SA presents exclusive tables to analyze organizational performance. In general, this tool could show performance indicators, action plans, comparative graphics or radars. In comparison, this is a better version of the department joints, from where they are added with results.

SA Pivot
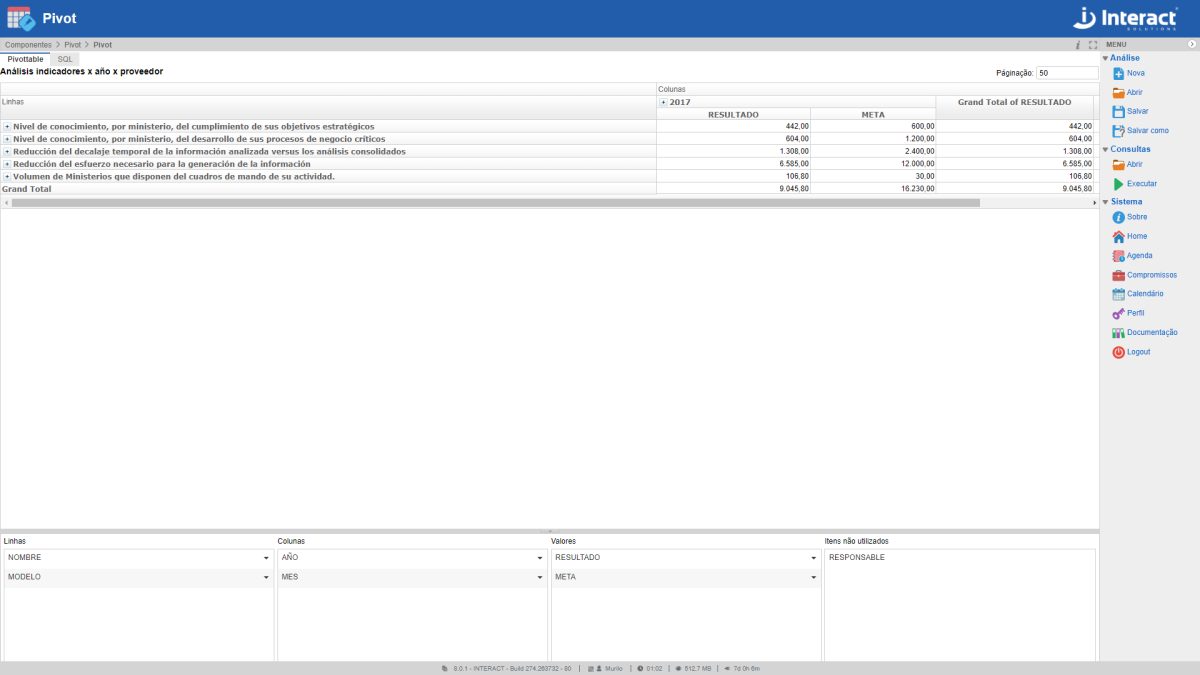
The tool SA Pivot offers the user an efficient analysis of a large volume of data, with dynamic composition of tables, data set of different sources and filtering of relevant information.
SA Project Canvas
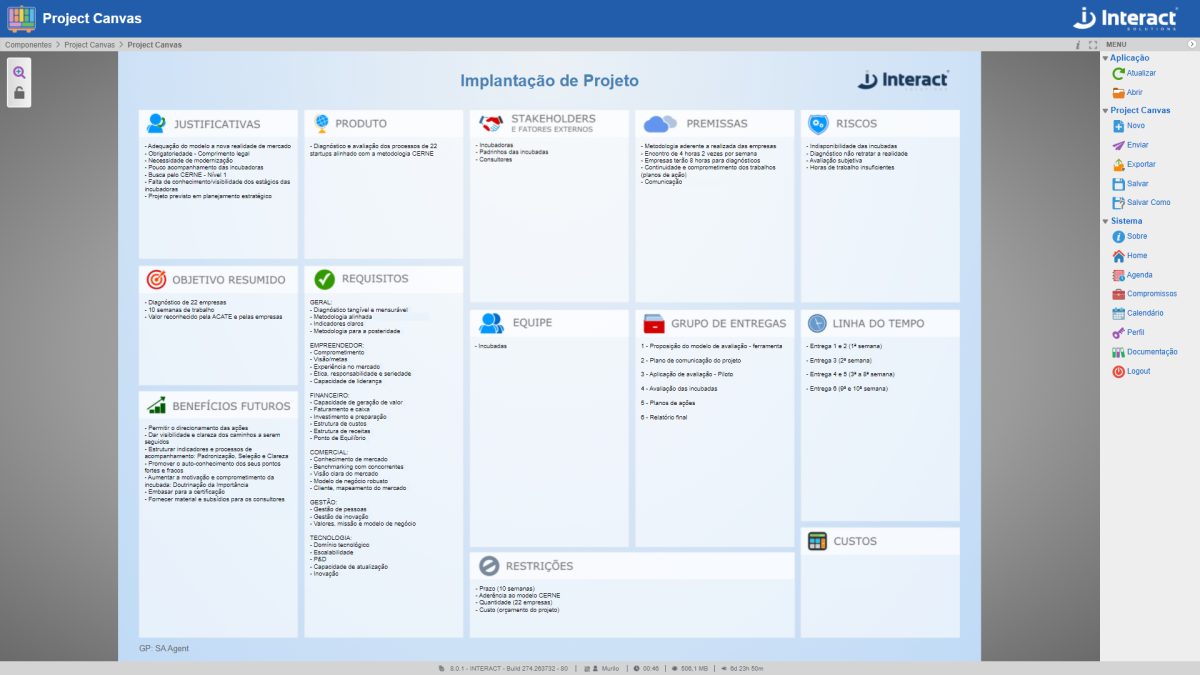
Interact’s SA Project Canvas is a tool for developing the Project Model Canvas methodology, ideal for innovative and dynamic environments. Through it, it is possible to visualize the entire scope of a project in a single image and develop projects collaboratively. In addition, the application allows export in PDF and PNG formats.

SA Reports
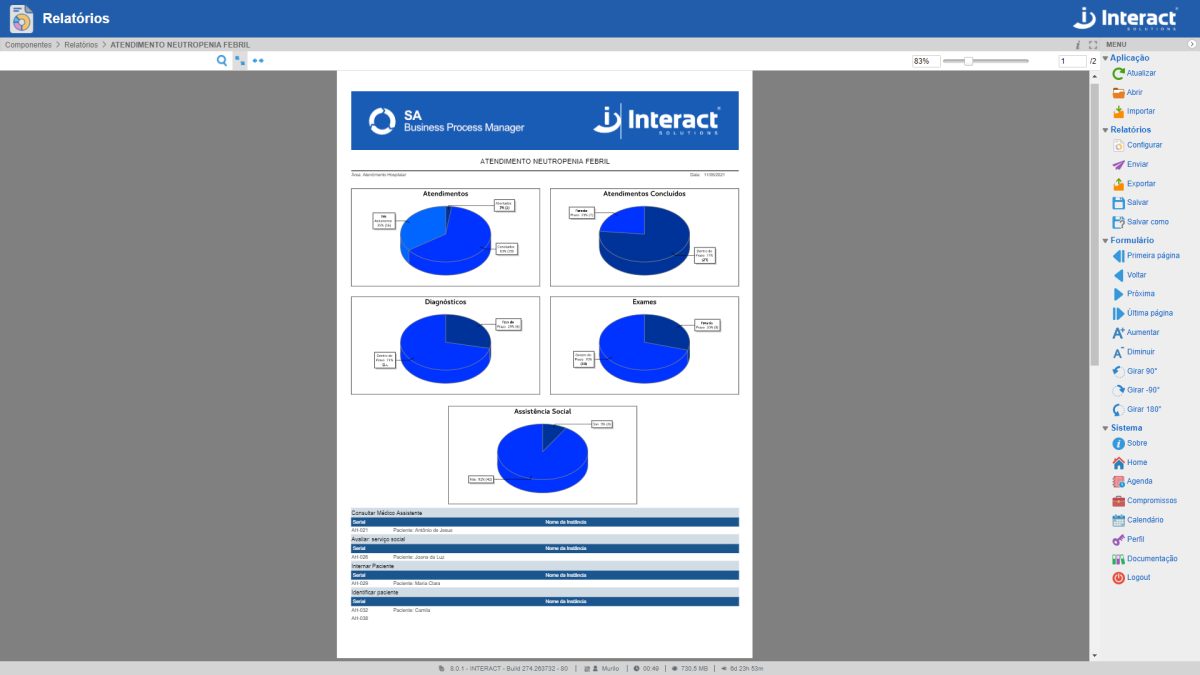
The SA Reports application makes it possible to generate reports with practically all the information contained in the system. The information can be customized, according to the user’s specific needs.

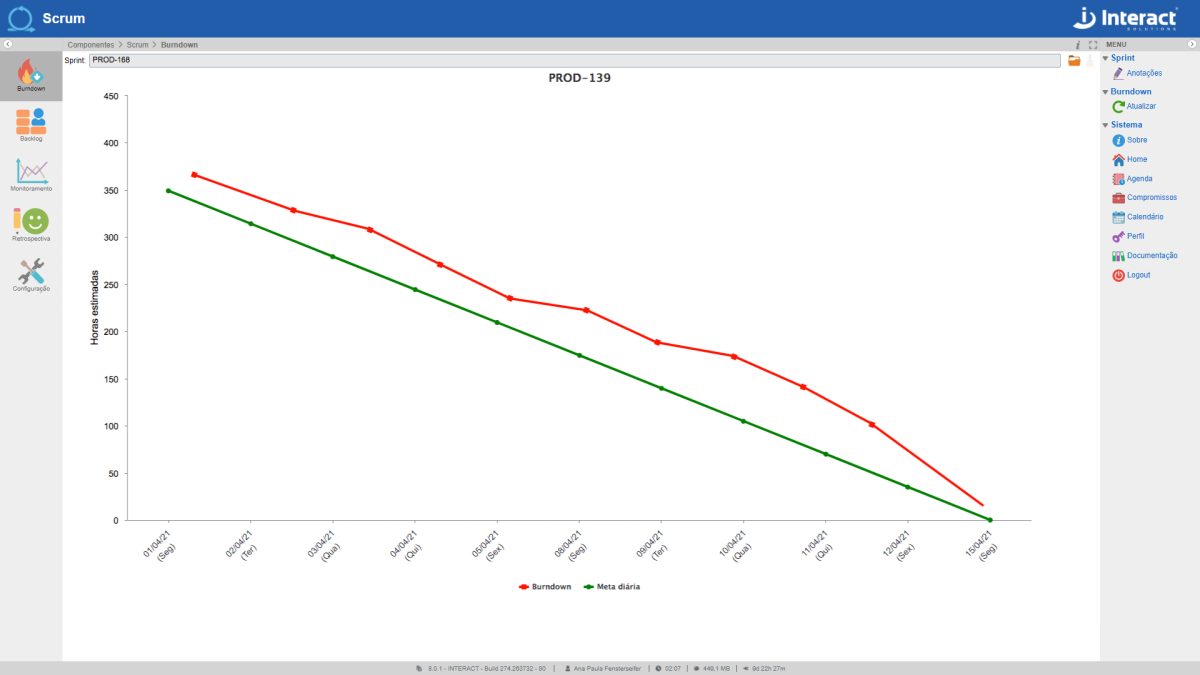
SA Scrum
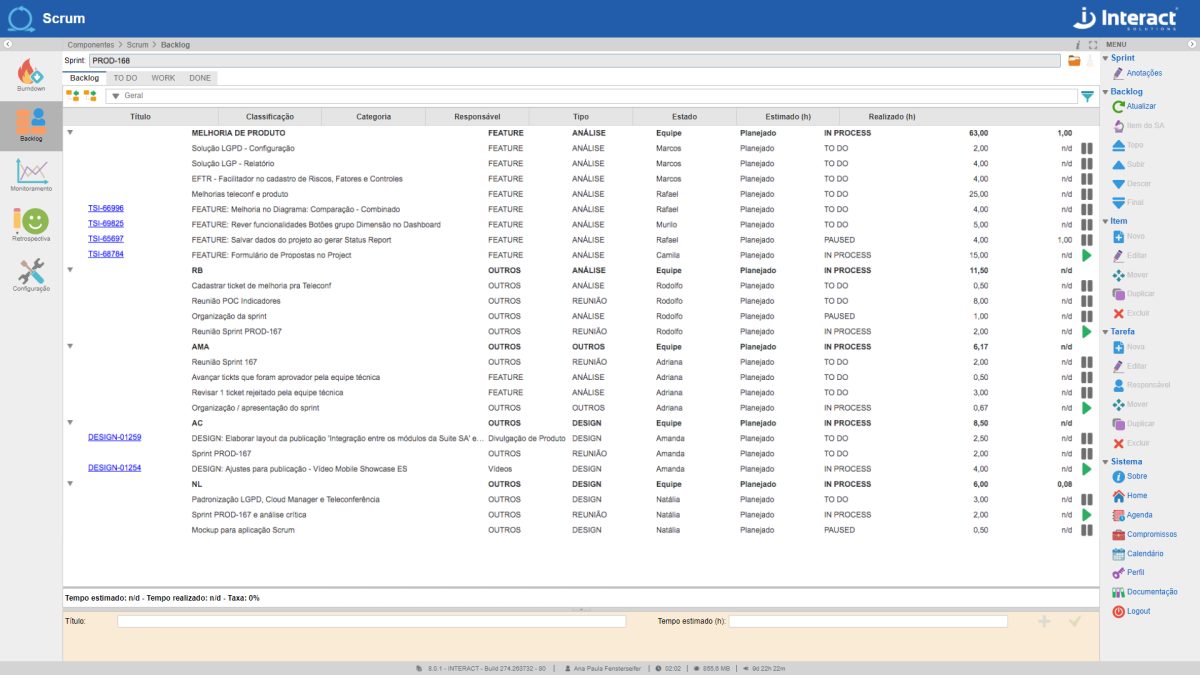
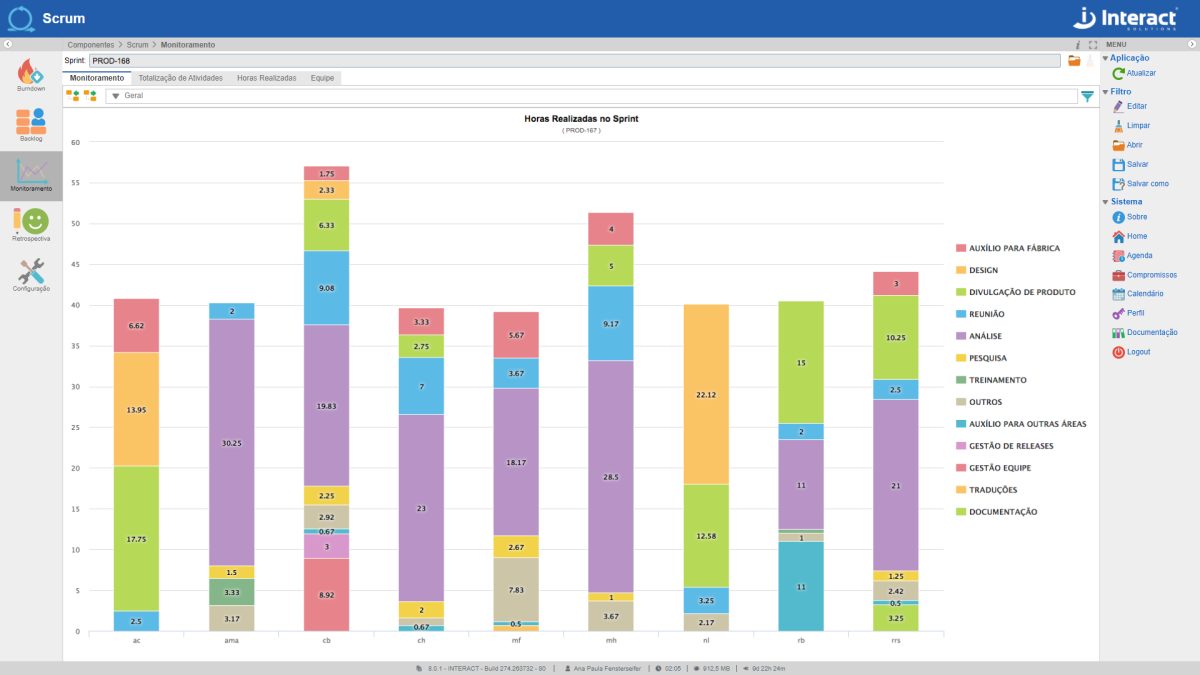
One of the fastest growing methodologies in the world currently available to optimize the results of your company’s projects. Get to know SA Scrum, from Interact Suite SA, which guarantees the implementation of the agile Scrum methodology in your projects. Interact’s tool allows the creation of several project sprints and the monitoring of different teams.
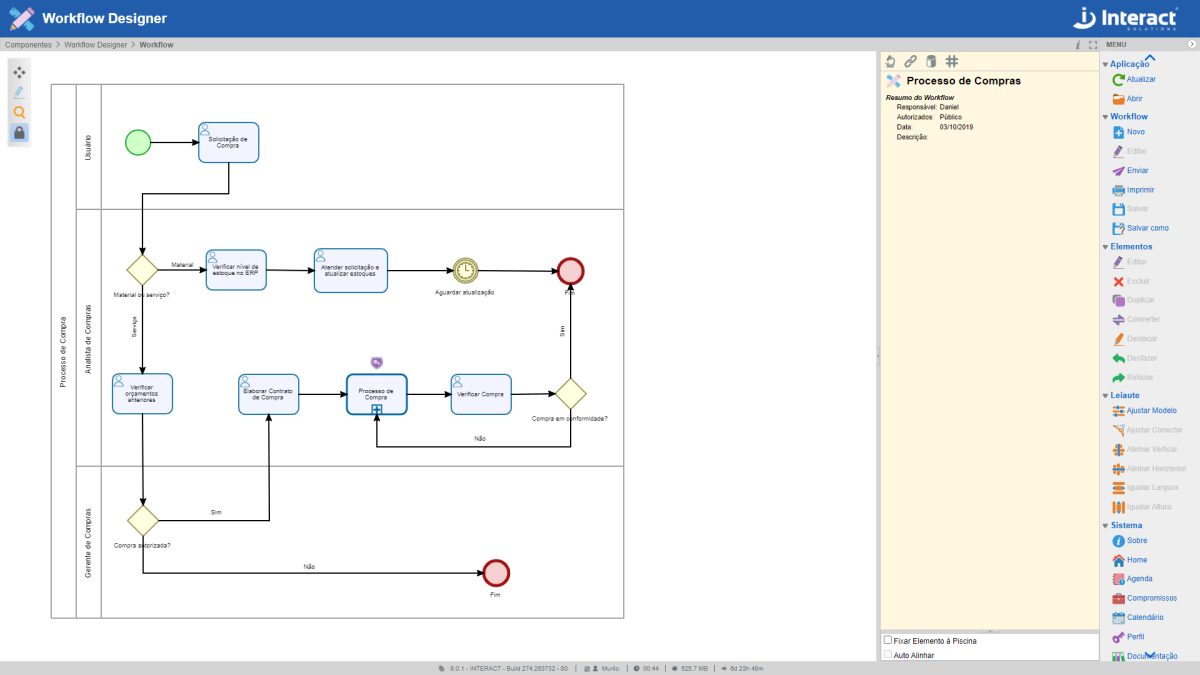
SA Workflow Designer
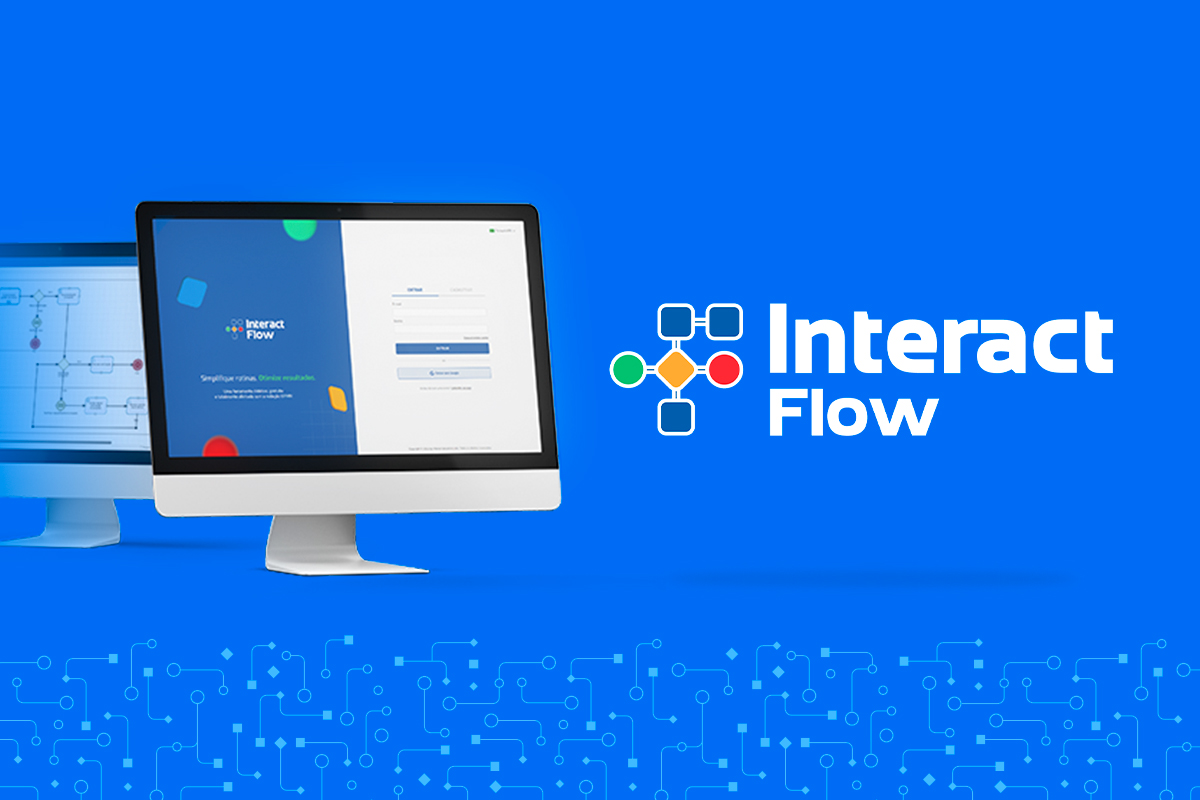
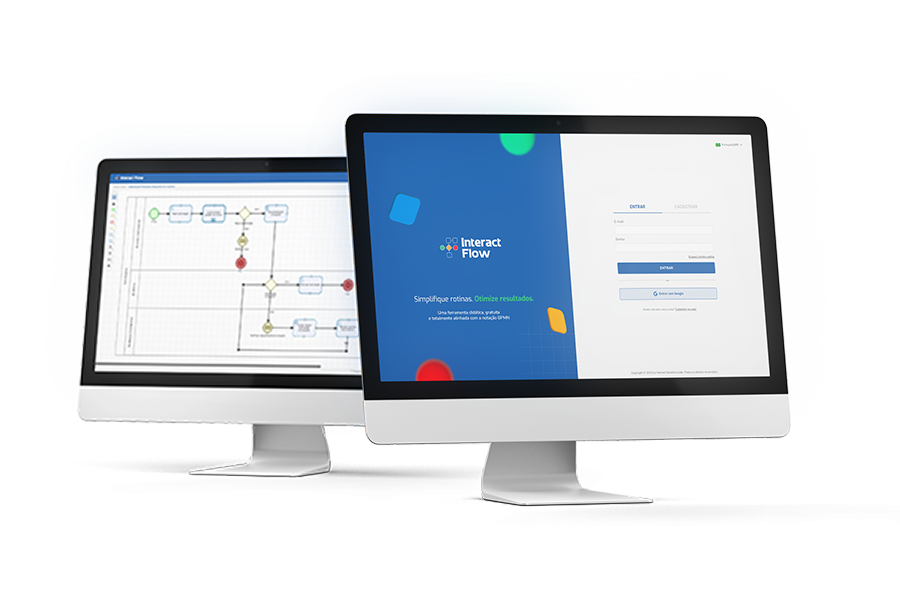
The SA Workflow Designer tool was developed to simulate and document processes or workflows. Similar to the elements of the BPMN (Business Process Model and Notation) notation, it is possible to model workflows according to a set of rules, with the aim of automating business processes. Integrated with the free tool, Interact Flow has current notation elements that meet modern methodologies.

Want more benefits?
Register your informations so that we can contact you as soon as possible.
Request contactProcess Management and Customer Journey
To broaden the systemic vision and analytical thinking of its clients and not just use a tool, Interact has the support of its newest Ambassador: Gart Capote!
Gart is one of the pioneers of BPM in Brazil, studying and practicing the discipline with technological support (BPMS) since 2004. He regularly works as a consultant, instructor, and speaker on BPM and Customer Orientation for various institutions in Brazil and abroad. He is also a Certified Business Process Professional (CBPP), founder, and president of ABPMP in Brazil for 8 consecutive years.
In addition to being an international leader for the BPM professionals’ community, he is also a highly respected practitioner for his projects, results, and ethics.

Discipline + Technology
From this joint work, tools dedicated to BPM process optimization will gain more support, expanding the possibilities of work within organizations.
Gart brings this vision in his content, well-addressed in the ‘Customer Journey.’ A methodology, divided into 8 steps aimed at understanding the customer, understanding the tasks, describing the objectives, developing solutions, building the journey, detailing hypotheses, describing changes, and finally, building the Canvas.
To learn more about the Process Management Solution and actions with Ambassador Gart Capote, follow our channels.
Subscribe to our newsletter
Structure your business processes now
Check out our latest content
What our clients say
Where we are
Get in touch and find out which is the best tool for your business.

