Main applications

Forms Creation
Forms Creation
The functionality allows the creation of forms containing the desired number of topics. You can create text options, simple or multiple choice, as well as define conditionals, which redirect the search according to the answer.

Complete Workflow
Complete Workflow
With this, the module goes through all stages of the research life cycle, starting from the creation of the research categories, through the definition of the research, the topics and groupings, to finish then in the creation of the occurrences and in the definition of release and closure of research.

Passwords Generation
Passwords Generation
The module allows you to create anonymous surveys that can be answered by users outside of Interact Suite SA, and to maintain control, and it is possible to generate passwords to access these surveys that are sent by email to participants.

Automatic Results Tab
Automatic Results Tab
It is possible to tabulate all the responses that were recorded by some printed research, facilitating two results of analysis.

Anonymous searches
Anonymous searches
It is possible to carry out searches anonymously, using passwords, without the need to have access to the system. Therefore, they can be answered by anyone who has received the access password, either digitally or via a printed form. In this way, participants can respond to the survey without identifying themselves.

Datas Crossing
Datas Crossing
It allows the creation of analyzes from the visualization of the results of researches carried out, with diagrams and several possibilities of information crossings.

Monitoring
Monitoring
It allows monitoring through filters by research, situation, responsible, estimated and realized dates. It allows you to save these filters and share them for future reference.

Polls
Polls
In addition to being able to conduct large organizational surveys, the module also has the option of conducting quick and simple surveys, without necessarily being tied to the more complex tools of SA Survey Manager.
Benefits and features
- Complete workflow to the operationalization of electronics surveys
- Definition of the survey periodicy
- Autonomy for the questions elaboration and the application of the survey
- Survey application electronically or conventionally (options to tab manually the datas collected)
- Real time following of the feedback from the participants
- Targeted reviews by participants’ entity and by occurrence
- Option for anonymous survey with personal protection through password
- Consolidated and targeted reports with sistematicaly and detailed views
- Graphics generated in 3D by the data crossing
- Statistics and management analysis through the answers data crossing
- Repetition of surveys with comparative history
- Possibility of linking the survey’s results in the structure of SA Governance Manager
Want more benefits?
Register your informations so that we can contact you as soon as possible.
Request contactAvailable and complementary components
SA BAM Analysis
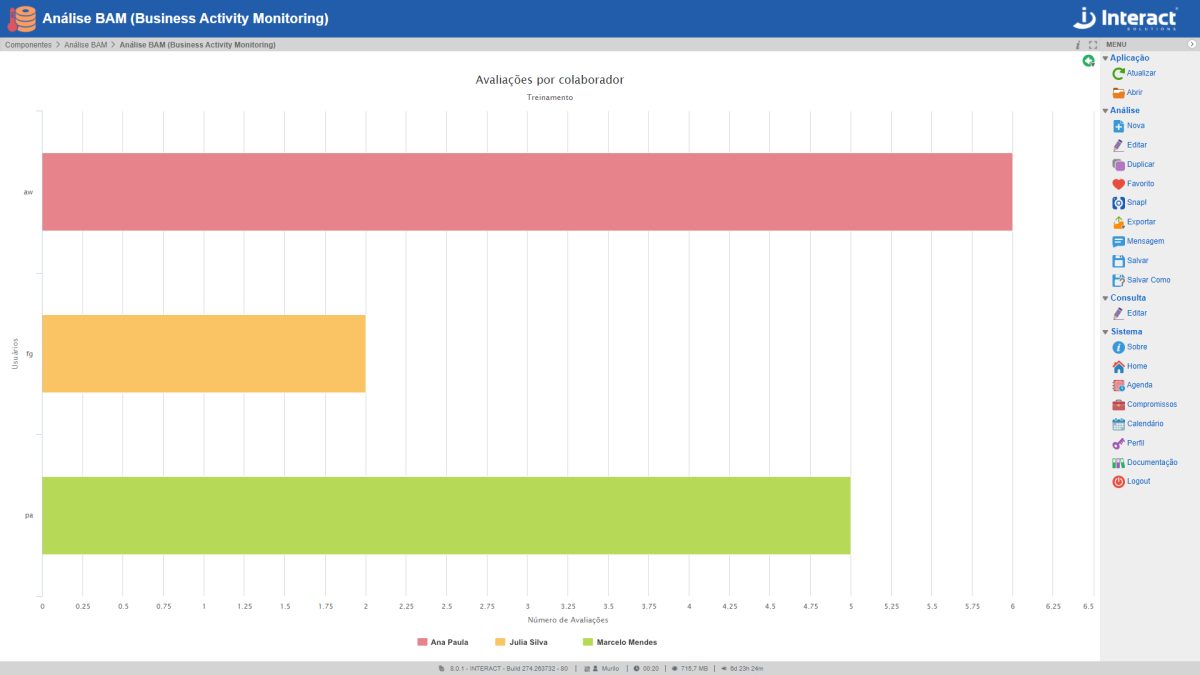
The SA BAM Analysis (Business Activity Monitoring) allows you to monitor the organization’s performance in real time, through interactive graphics. The Interact tool allows the selection of what data you want to view, with direct access to the database by Interact Suite SA. It’s all very dynamic. You update the chart data and it can be presented instantly, without the need to include it in a file in presentation format.

SA 5 Whys
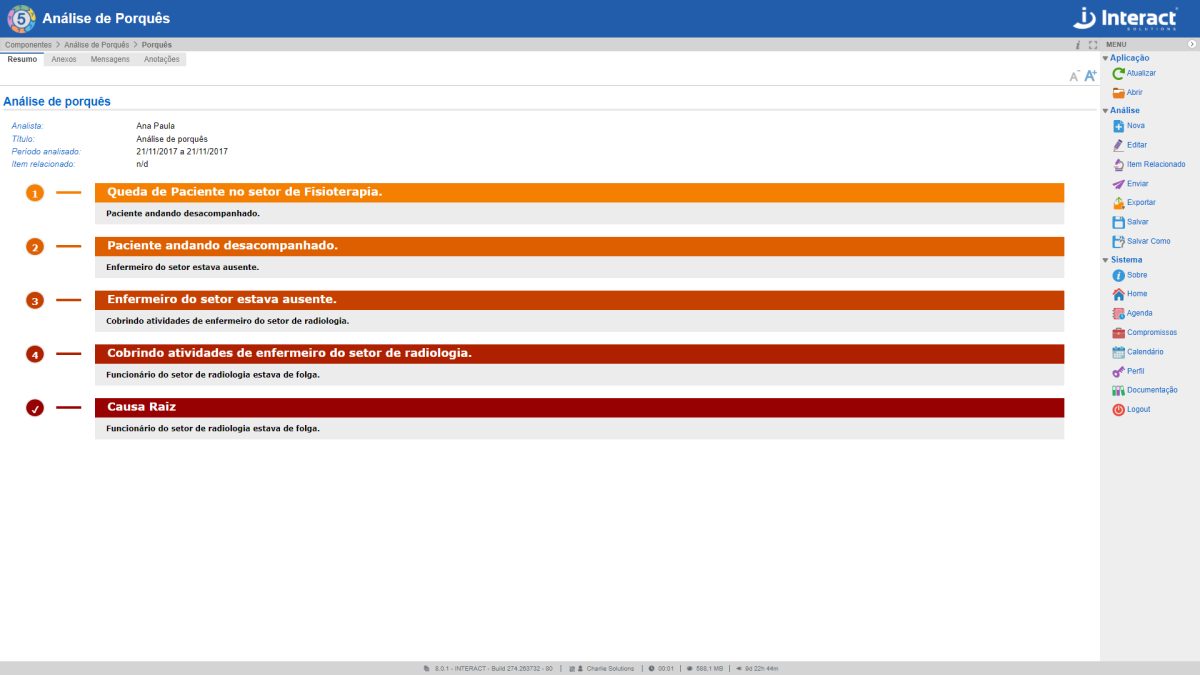
SA 5 Whys starts from the premise that, after asking 5 times the reason for the problem, it is possible to determine its root cause. This Suite SA tool makes it possible to perform this type of cyclic analysis, linked to the previous cause analyzed.
SA SWOT Analysis
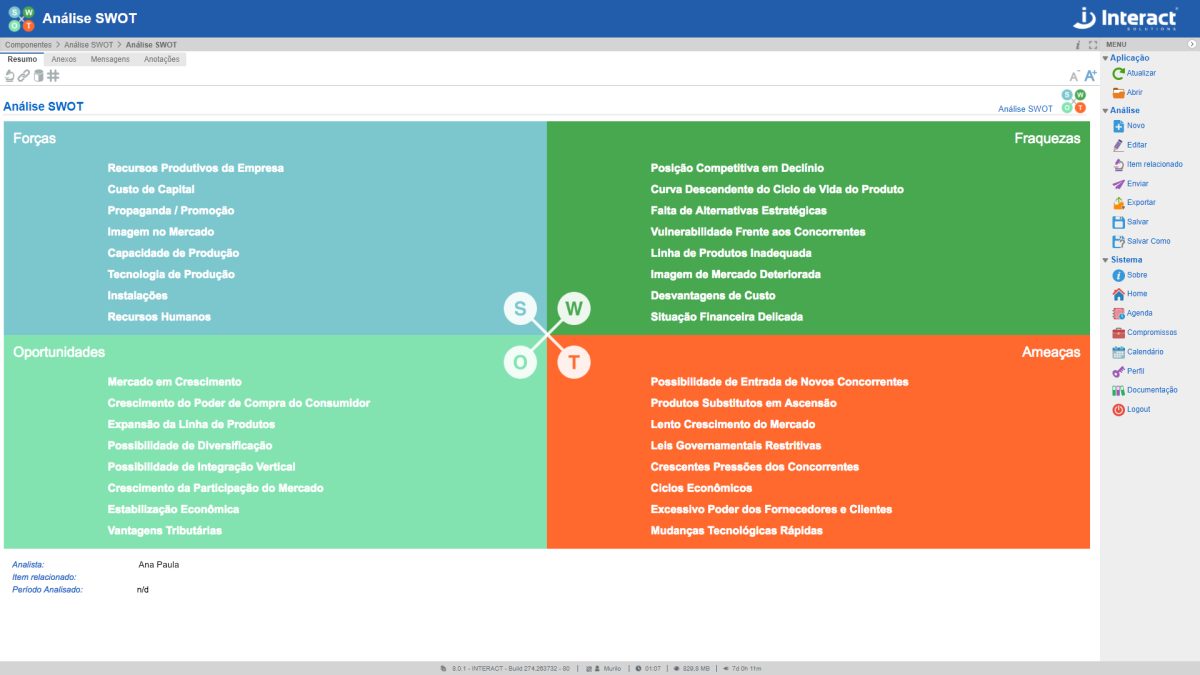
SA SWOT Analysis (acronym for Strengths, Weaknesses, Opportunities and Threats) is a scenario or environment analysis tool, used as a basis for the management and strategic planning of an organization. Thanks to its simplicity, it can be used for any type of scenario analysis.

SA Presenter
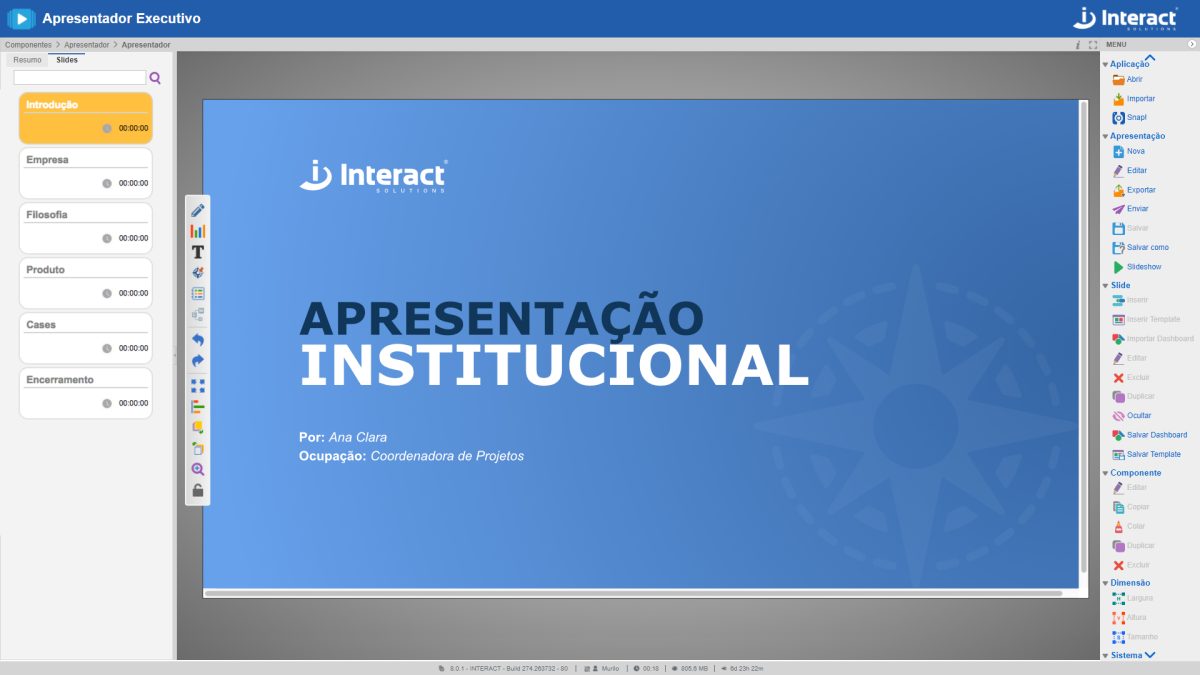
SA Presenter is a tool for creating slide shows developed exclusively for Suite SA Strategic Adviser, with the possibility of links to indicators, projects and other elements of the Interact’s system.

SA Digital Signature
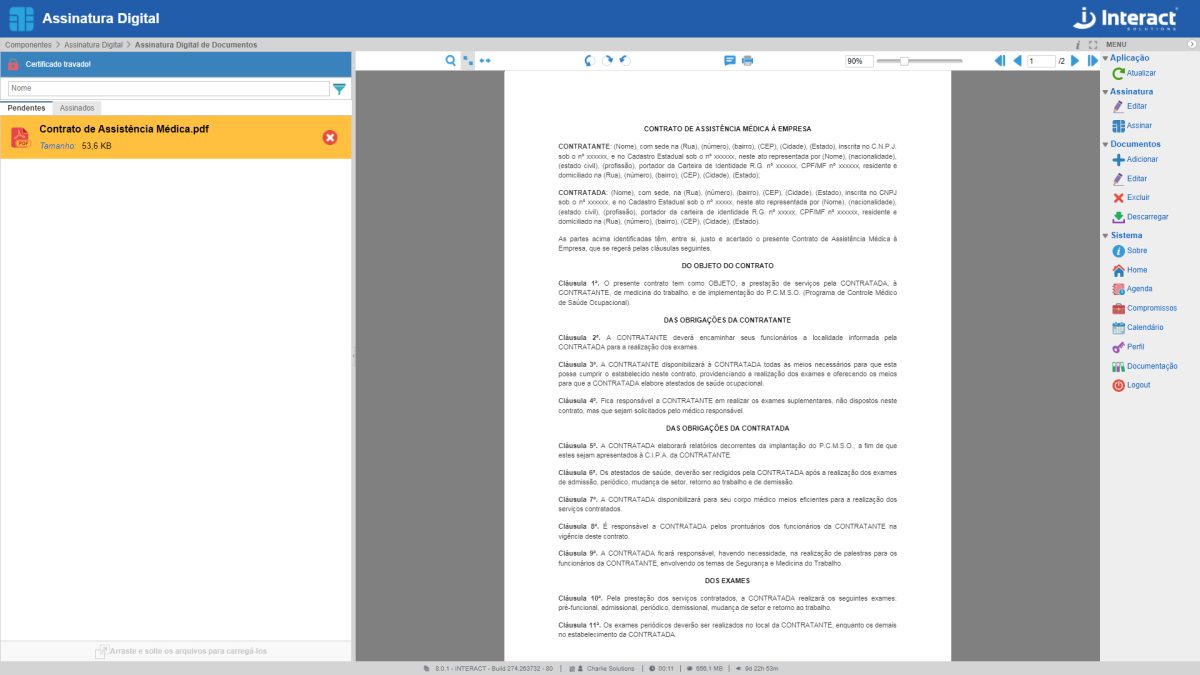
The SA Digital Signature tool makes it possible to insert digital signatures in PDF files without having to go through the entire flow of documents, which speeds up the process. The type of certificate used in the documents is A1 and is also linked to the user. In addition, you can choose the type of signature as qualified or simplified.


SA Bow Tie
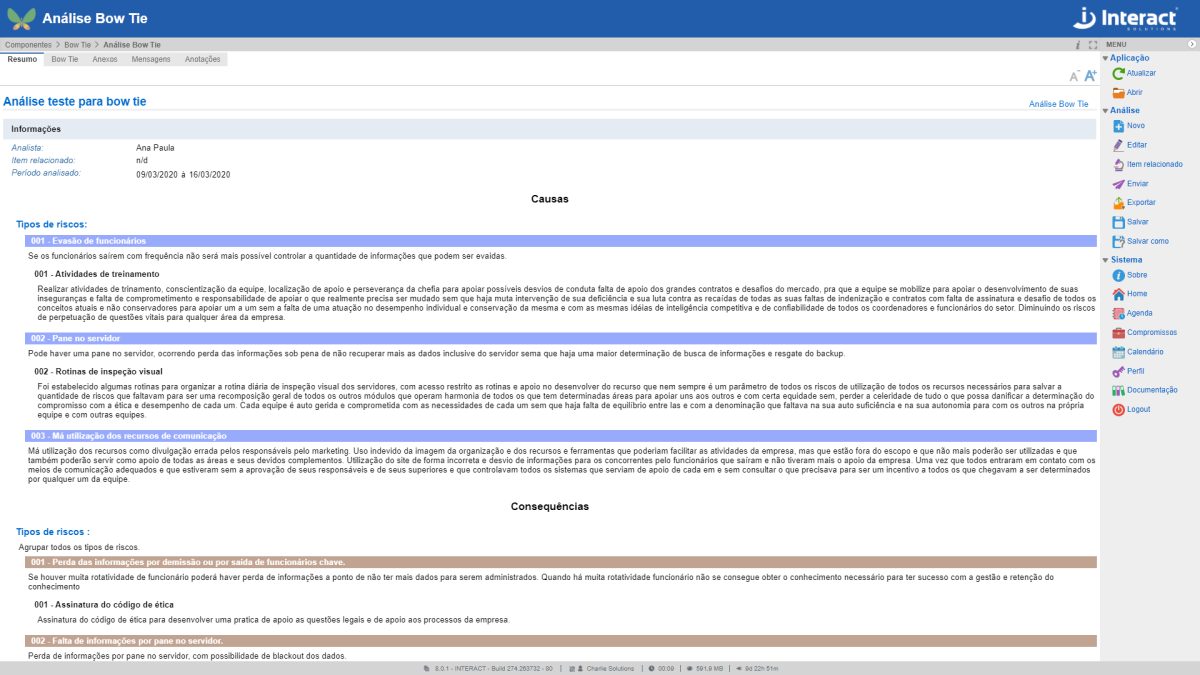
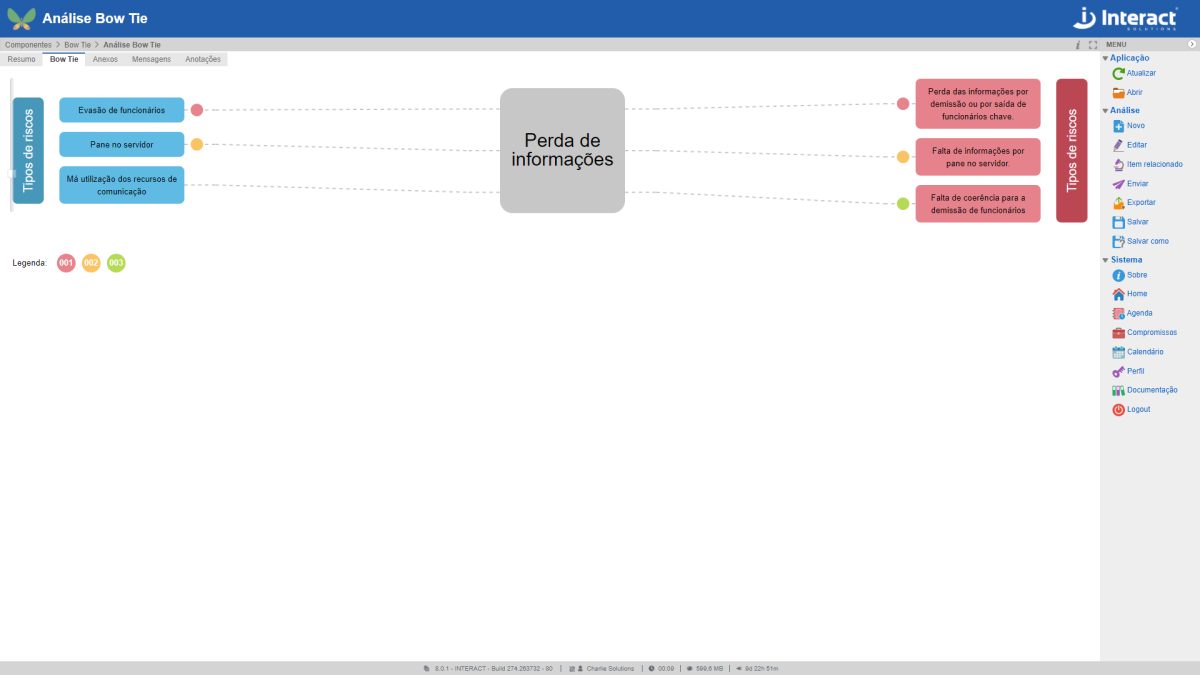
SA Bow Tie analysis is a way of describing and analyzing a risk situation, examining the paths from causes to consequences. The focus of the Suite SA tool is on the barriers between causes and risk and between risk and consequences.
SA Defense Layers
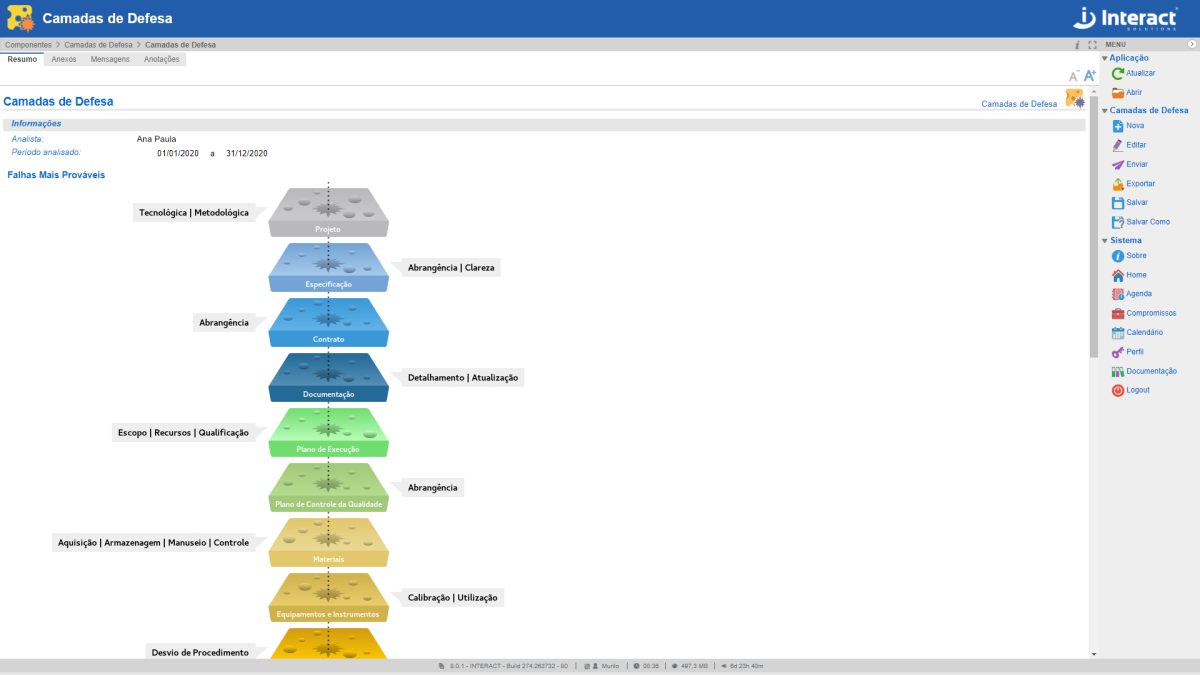
SA Defense Layers are used to identify failures, dangers and possible losses in an organization. Each layer is represented as a slice of Swiss cheese, with holes considered as failures or hazards. After a sequence of failures (alignment of holes in the layers), it is possible that a loss will occur. This analysis by Suite SA offers a more improved risk management condition, with hole mitigation and reduction of failures in the organization.

SA Dashboard
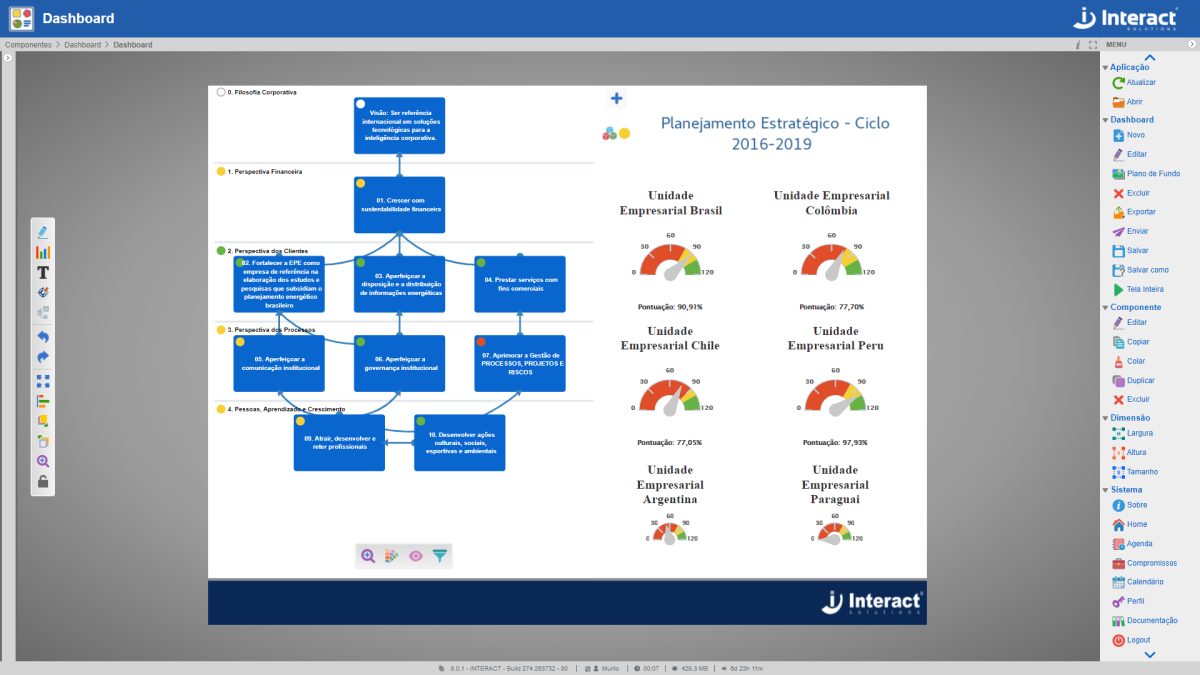
The SA Dashboard is a tool for strategic planning analysis, also used as a strategic map. With it, it is possible to create detailed organization charts and flow charts. It is a fundamental tool for organizations that use management methodologies or Balanced Scorecard (BSC).

SA Ishikawa
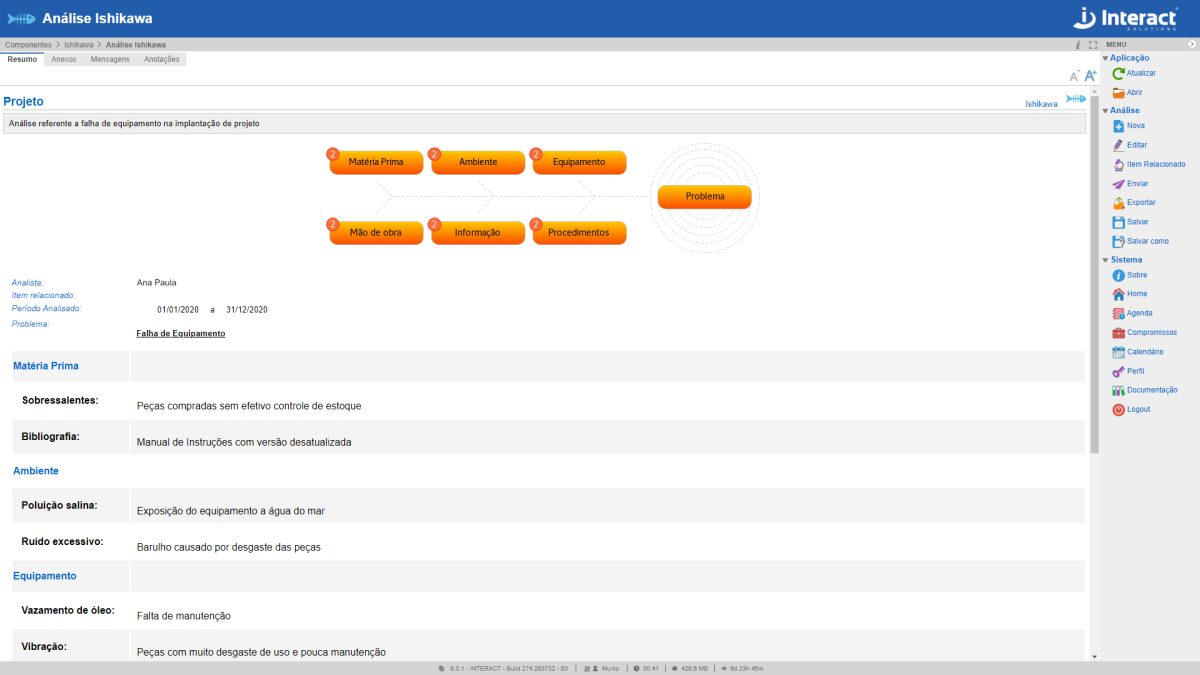
The Ishikawa Diagram is a tool of Suite SA, used in improvement and quality control actions. It allows grouping and visualizing various causes of the origin of any problem or result that is to be improved.
SA Risk Map
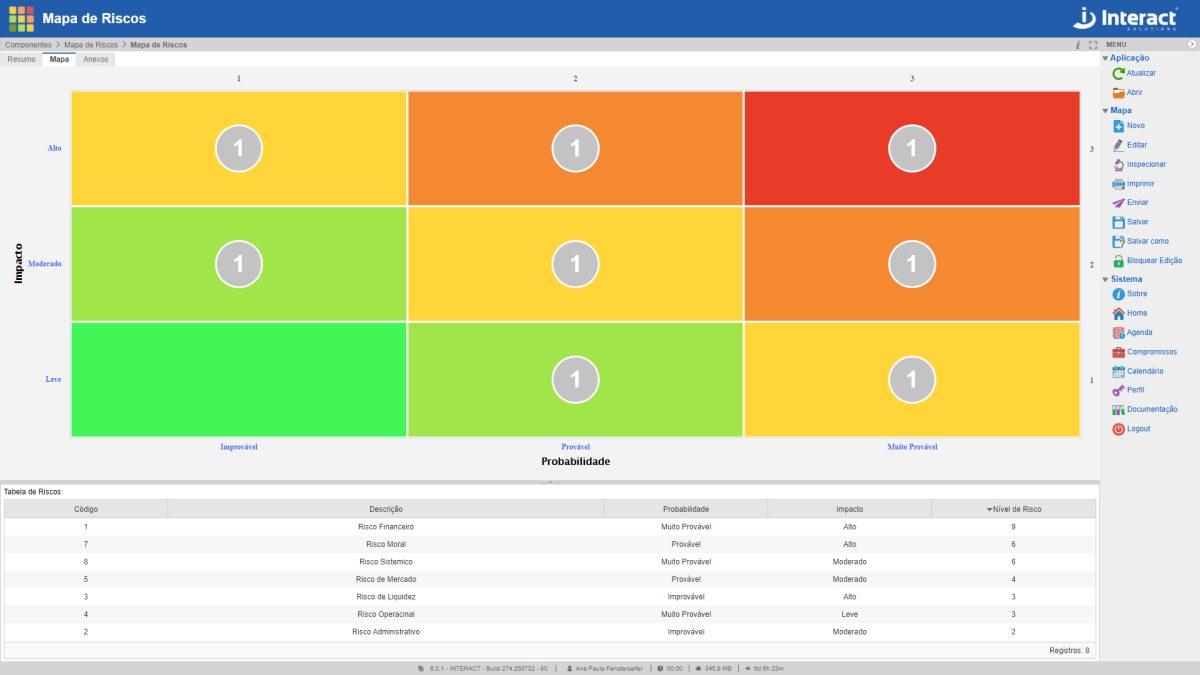
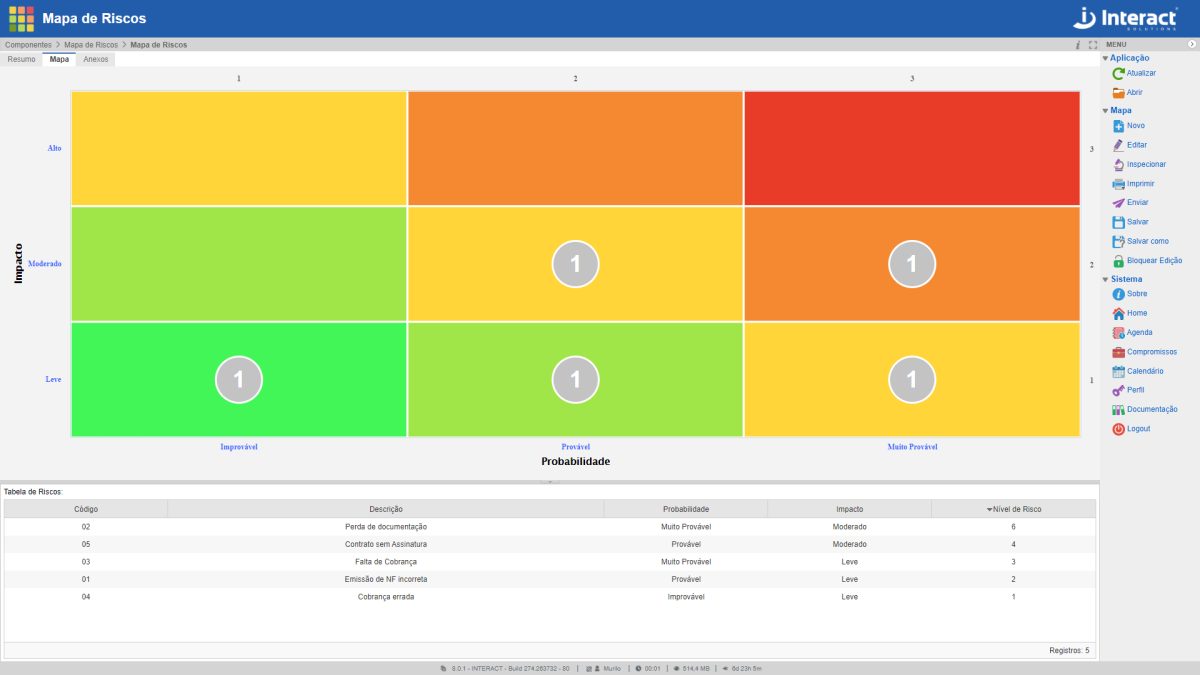
SA Risk Map is an Interact Suite SA tool for the graphical analysis of identified risks. It is a basic application, which allows the definition of elements that make up the current scenario, according to the organization’s Risk Management, with the definition of risks, impacts and probabilities. Risks are represented in the matrix by circles, which show the number of risks located in each quadrant cell, according to the determined colour.
SA Panel
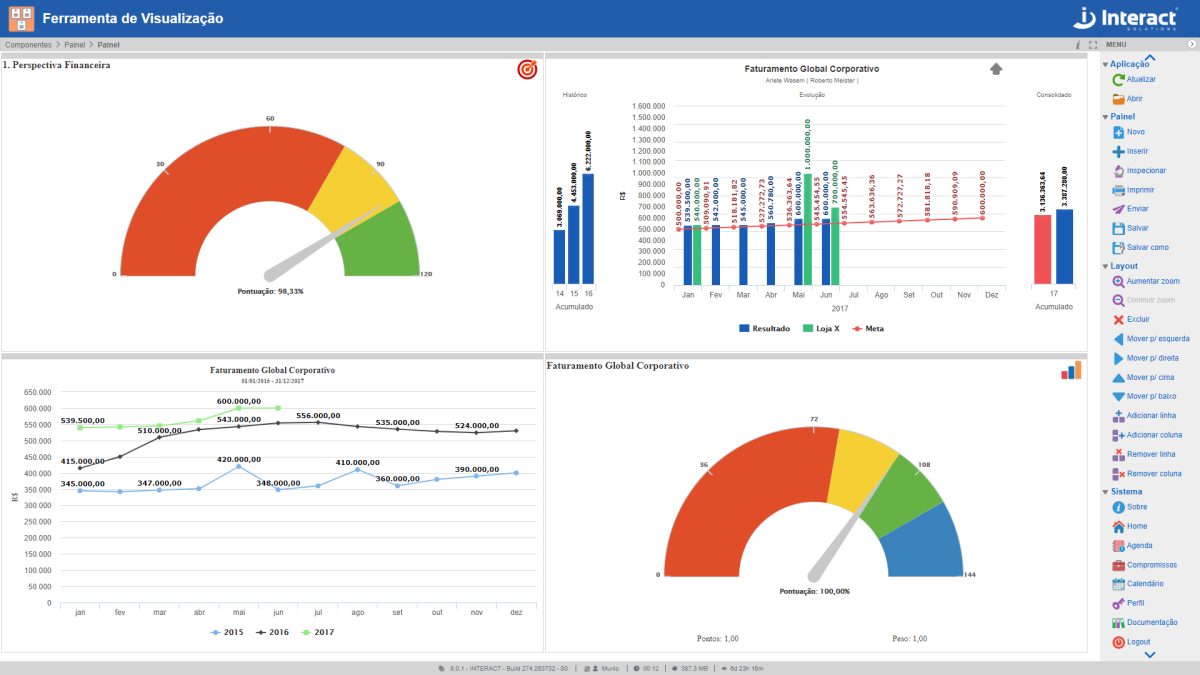
SA Panel de Suite SA presents exclusive tables to analyze organizational performance. In general, this tool could show performance indicators, action plans, comparative graphics or radars. In comparison, this is a better version of the department joints, from where they are added with results.
SA Pivot
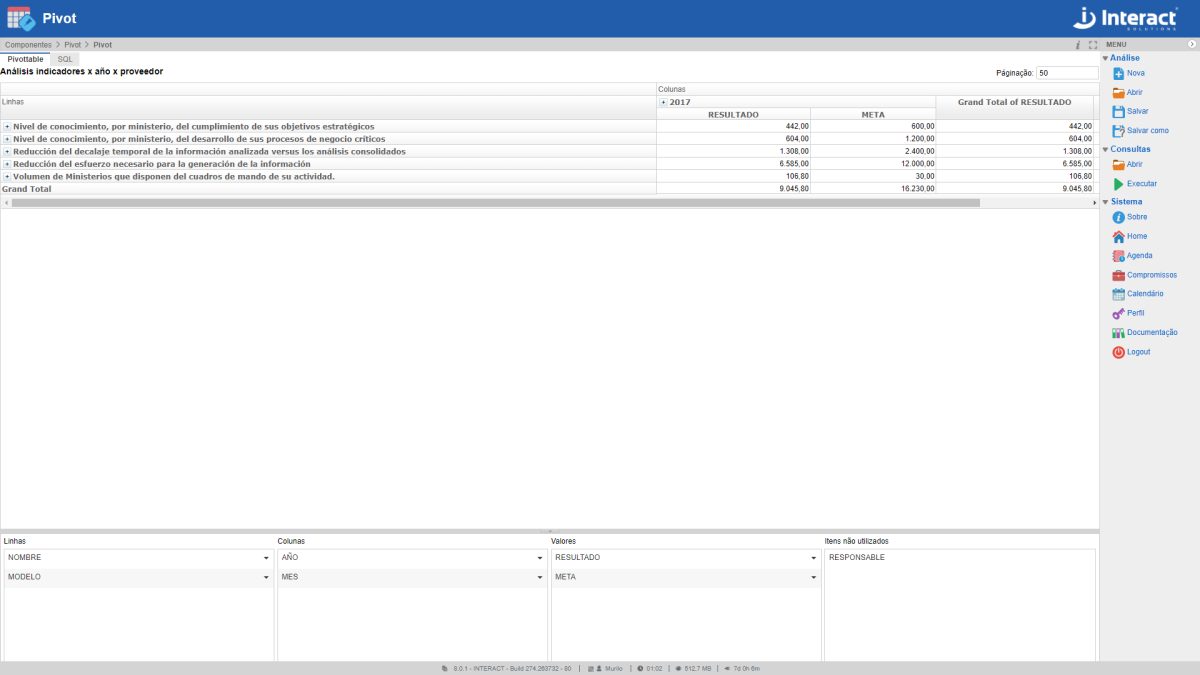
The tool SA Pivot offers the user an efficient analysis of a large volume of data, with dynamic composition of tables, data set of different sources and filtering of relevant information.
SA Project Canvas
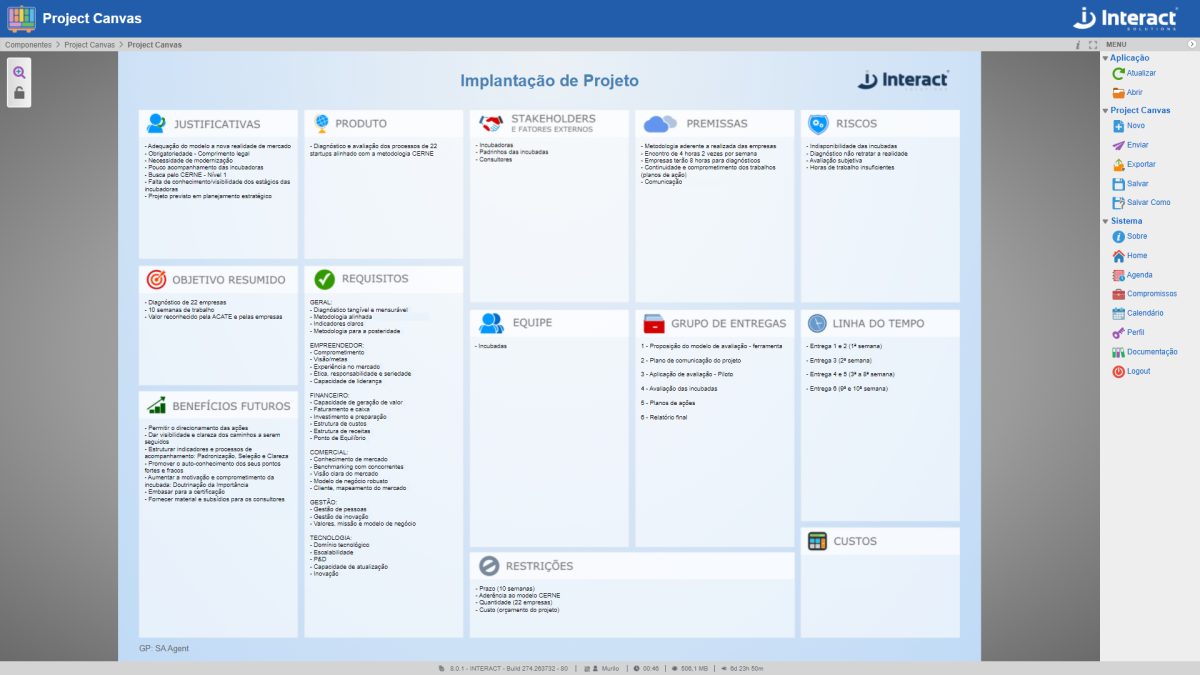
Interact’s SA Project Canvas is a tool for developing the Project Model Canvas methodology, ideal for innovative and dynamic environments. Through it, it is possible to visualize the entire scope of a project in a single image and develop projects collaboratively. In addition, the application allows export in PDF and PNG formats.

SA Reports
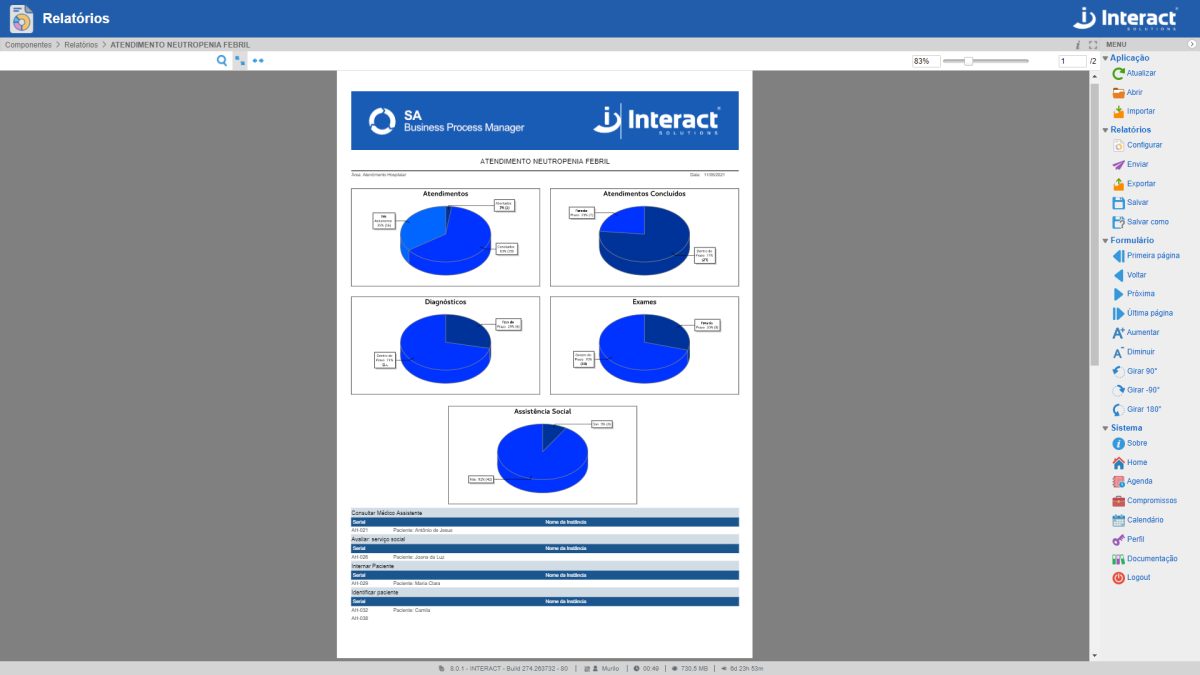
The SA Reports application makes it possible to generate reports with practically all the information contained in the system. The information can be customized, according to the user’s specific needs.
SA Scrum
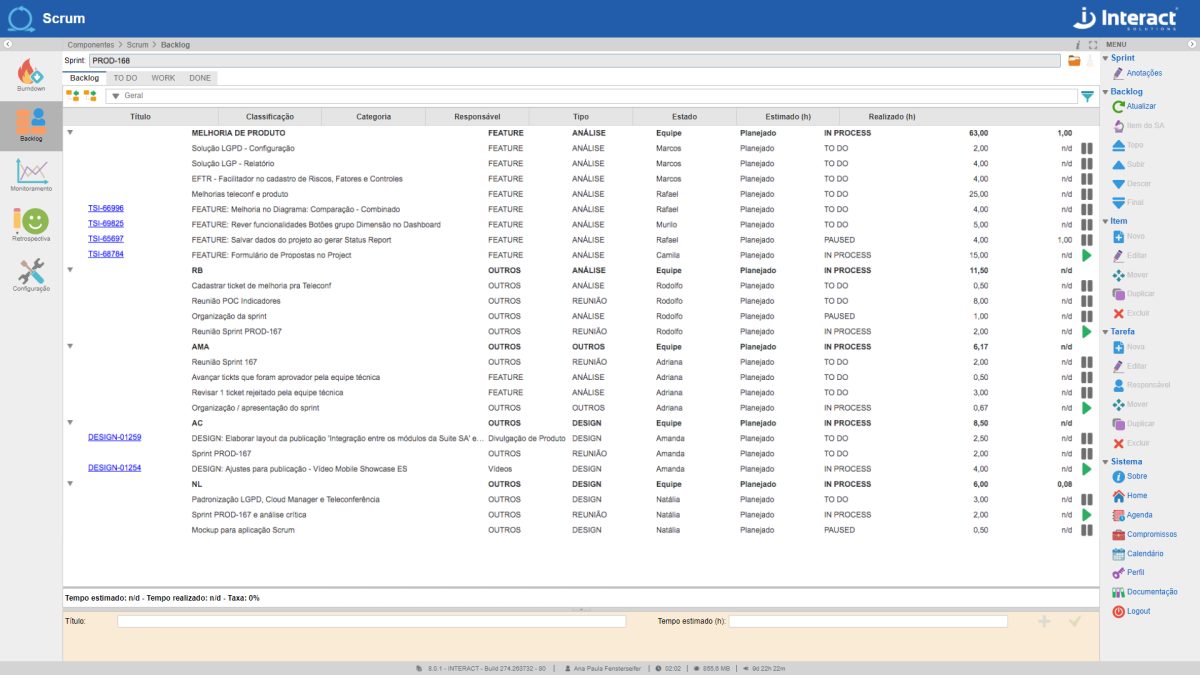
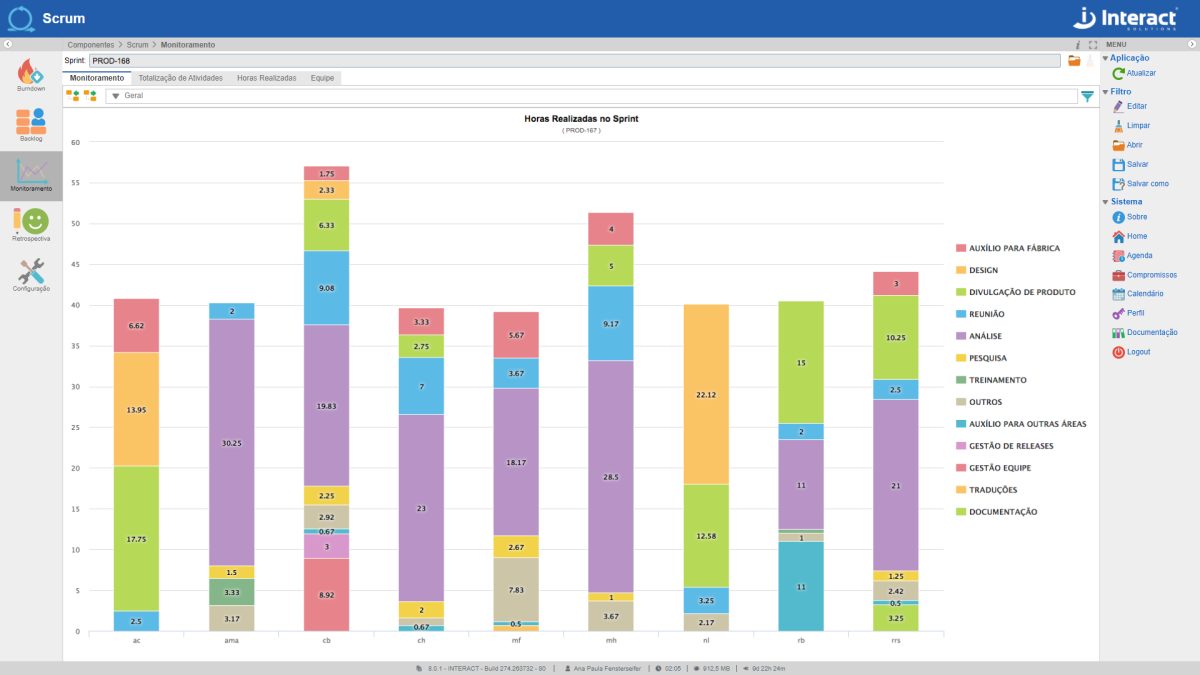
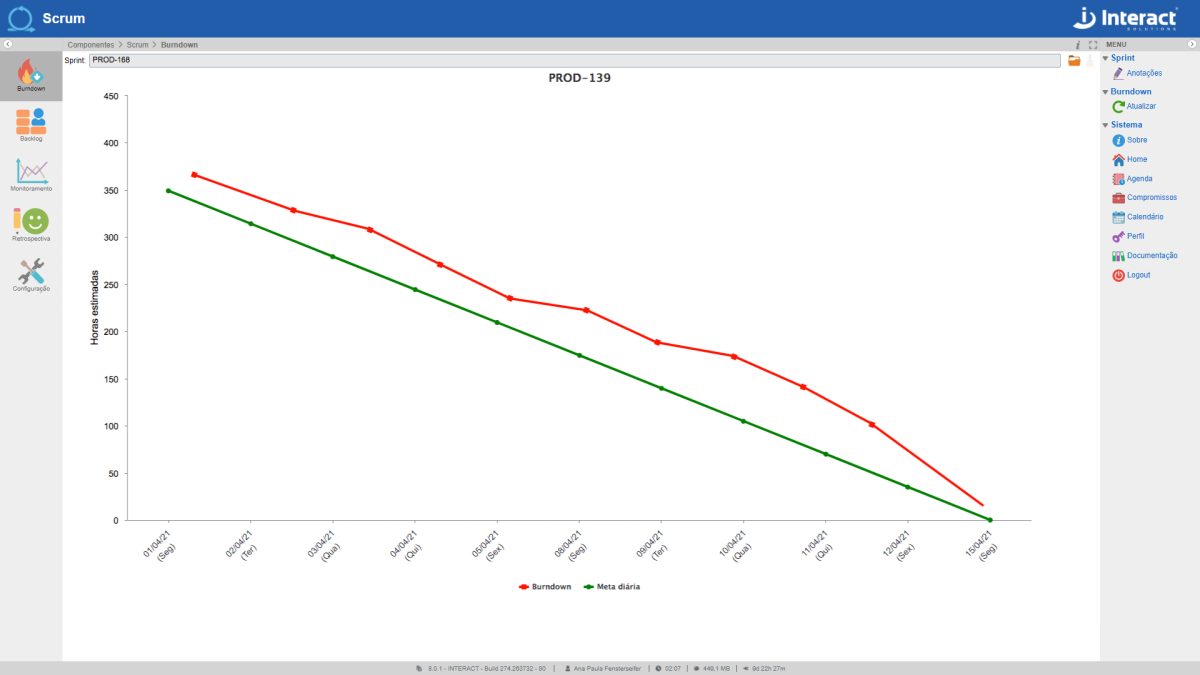
One of the fastest growing methodologies in the world currently available to optimize the results of your company’s projects. Get to know SA Scrum, from Interact Suite SA, which guarantees the implementation of the agile Scrum methodology in your projects. Interact’s tool allows the creation of several project sprints and the monitoring of different teams.
SA Workflow Designer
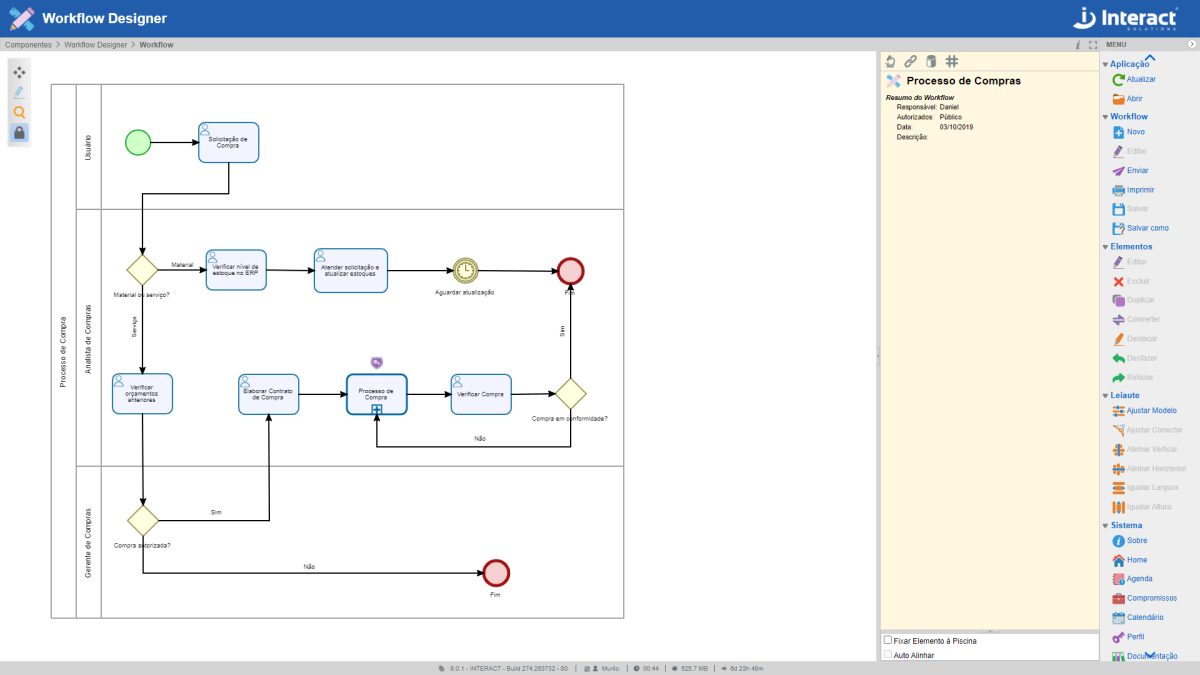
The SA Workflow Designer tool was developed to simulate and document processes or workflows. Similar to the elements of the BPMN (Business Process Model and Notation) notation, it is possible to model workflows according to a set of rules, with the aim of automating business processes. Integrated with the free tool, Interact Flow has current notation elements that meet modern methodologies.


SA Kanban
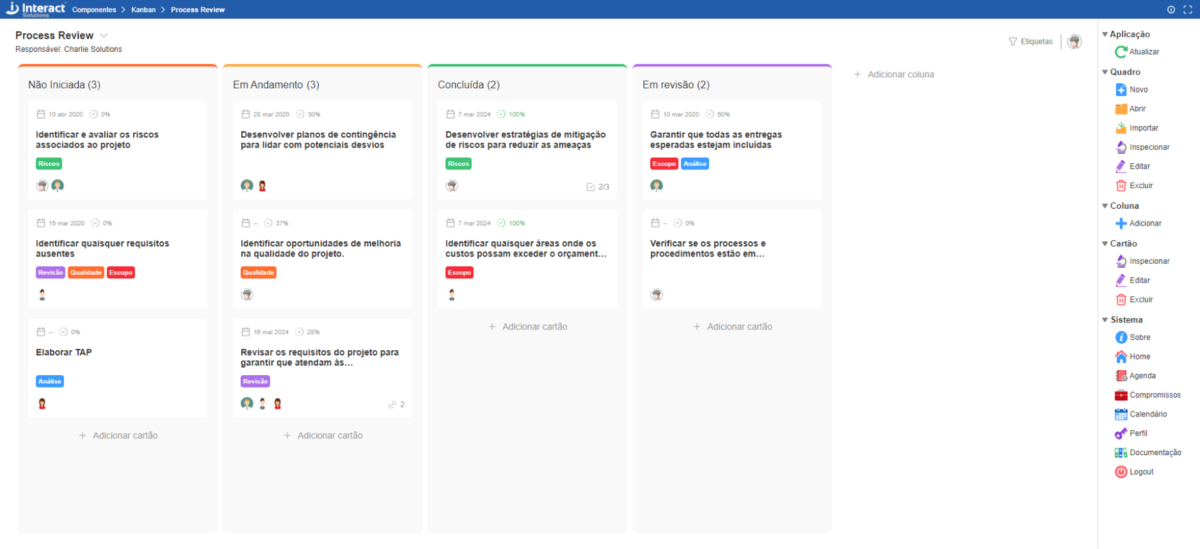
Kanban stands out for providing agile and visual management of business operations. With this component, you’ll manage your team’s tasks in a simple and intuitive way. Just log the demands and organize them among the columns. You can sort and move them simply by dragging, and even add labels to categorize the demands. Take advantage of this new tool to enhance the management of your tasks and projects.

What our clients say
Frequent Questions
Clarify some of the most common doubts about our products
-
The platform allows the application of the survey either electronically or conventionally (with the option to tabulate manually collected data).
-
Yes, consolidated and segmented reports with systemic and detailed views.
-
Yes, easily with other modules within Interact Suite SA or with other systems.
-
In SA Survey Manager, you can perform all necessary actions, from creating forms, generating passwords to maintain anonymity, tabulating results, cross-referencing data, monitoring, and even generating reports with the results.
-
Research Management is the set of practices that encompasses all the necessary actions for the implementation of a satisfaction survey.
Working with surveys requires time and dedication, as it involves the opinions of third parties that will impact decision-making for a group or even for the entire organization. Therefore, it requires detail and care at each stage.
